
Descrição
🏆 Mais de 10.000 Traders Confiam em Nossa Suíte de 25+ Algoritmos! 🏆
De Estrutura de Mercado & Liquidez até Sistemas Inteligentes de Saída & Ferramentas Preditivas - construímos TODAS as ferramentas que você precisa para consistência.
👉 Acesse Todos os 25+ Sistemas COMPROVADOS:
_______________________________________________
📌 Indicadores de Estrutura de Mercado
· ✅ AdvancedMarket Structure: Bos, Choch, SwinLevels, Order Blocks, Market Structure& Liquidity Finder
🔥Detector de Rompimento de Pivot
· 🔄 Análise Dinâmica da Estrutura de Mercado de Pontos de Virada
· 🧱 Bloco de Ordem
· ⛓️ BOS & CHOCH
· 🧠 ICT Poder do 3
· 🌀 Zonas de Polaridade de Mercado
_______________________________________________
🔚 Sistemas Inteligentes de Saída
· 📍 Algoritmo Inteligente de Trailing
_______________________________________________
📐 Indicadores ZigZag
· 🔍 Projeção de Liquidez de Preço ZigZag
· ➖ ZigZag
· 🎯 Rastreador de Extremos Zig-Zag
_______________________________________________
🧱 Indicadores de Suporte & Resistência
· 🟩 Linhas de Suporte & Resistência SmartTrend
· 🧱 Todos os Níveis de Suporte e Resistência
_______________________________________________
📊 Indicadores de Tendência & Canal
· 🔄 Canal de Tendência Automático
· 📊 Supertrend
· ⚡Analisador de Tendência Momentum
· 🧠 Canal de Tendência Adaptativo
· 💥 Sistema de Rompimento de Canal
· 🌈 Gradiente Dinâmico de Tendência
_______________________________________________
💧 Ferramentas de Volume & Liquidez
· 📉 Mapa de Liquidação de Alavancagem
· 🔍 Gap de Valor Justo Momentum
· 🕒 Sessões de Gap de Valor Justo
_______________________________________________
⚡ Indicadores de Momentum & RSI
· 🚀 Momentum de Alcance Dinâmico
· 🔎 Viés de Vela Multi-Nível
Rastreador
_______________________________________________
🔮 Ferramentas de Previsão & Projeção
· 📐 Previsão Baseada em Linreg& ATR
· 📏 Regressão Linear FibonacciMulti-tempo
· 📈 Projetor de Fluxo de Mercado Alimentado por Volume_________________________
_________________________________________________________________________________________________
_________________________________________________________________________________________________
ZigZag Structure Pro – 🚀
Identifica automaticamente os pontos de virada significativos do mercado (máximas e mínimas chave) e desenha zonas dinâmicas de suporte e resistência que se atualizam em tempo real. 🎯 Ao contrário dos níveis estáticos tradicionais, este indicador se adapta constantemente à estrutura de preço em mudança.
Para que serve? ❓
Este indicador é uma ferramenta profissional de análise técnica projetada para:
- Identificar níveis institucionais: 🏛️ Detecta automaticamente pontos onde o preço formou estruturas importantes de máximas e mínimas.
- Análise da estrutura de mercado: 📊 Classifica cada movimento de acordo com a metodologia de estrutura de alta/baixa (Higher Highs, Lower Lows, etc.).
- Projeção de tendência: 🔮 Estende linhas de tendência para o futuro para antecipar potenciais zonas de reação do preço.
- Reversões e continuações de trading: 💰 Os níveis marcados servem como referência para entradas, stop-loss e metas de lucro.
O indicador desenha no seu gráfico: ✍️
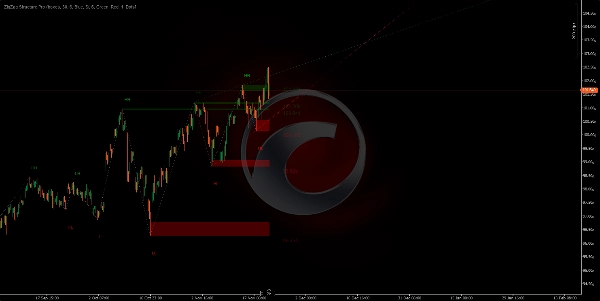
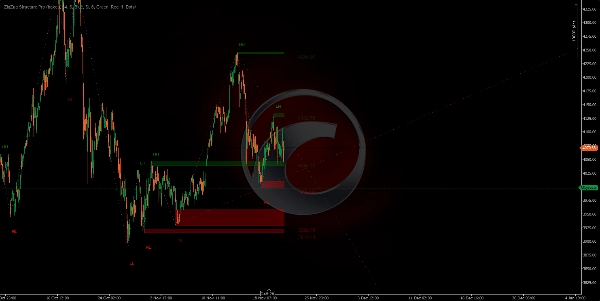
1. Zonas de Suporte/Resistência (Retângulos)
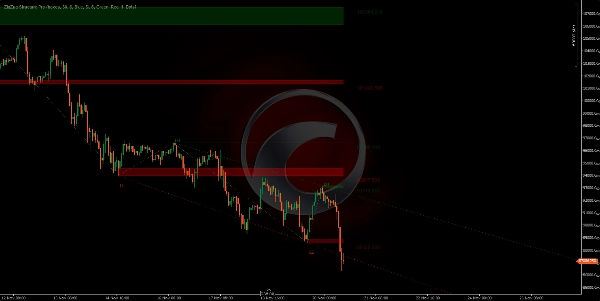
- Zonas verdes: 🟢 Marcam áreas de suporte (mínimas significativas onde o preço pode dar um salto).
- Zonas vermelhas: 🔴 Marcam áreas de resistência (máximas significativas onde o preço pode recuar).
- Essas zonas são projetadas para frente, mostrando os níveis ativos atuais.
- A espessura de cada zona representa o corpo da vela onde o pivot foi formado.
https://chartshots.spotware.com/c/691f5a4d75ac4
https://chartshots.spotware.com/c/691f6b4f2e98b
https://chartshots.spotware.com/c/691f6c6fda808
https://chartshots.spotware.com/c/691f6d0aa6155
2. Linhas de Conexão ⚡
- Conectam cada pivot com o próximo, criando um padrão visual de "zigzag".
- Eliminam o ruído do mercado, mostrando apenas os movimentos realmente significativos.
- Facilitam a visualização da direção e estrutura da tendência de relance.
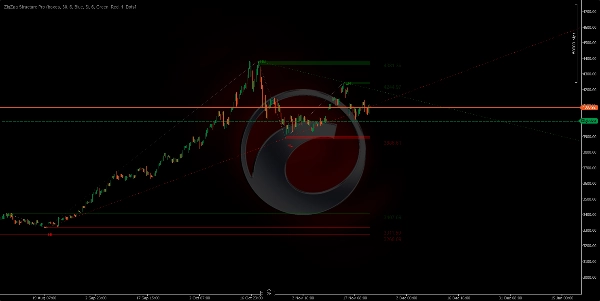
3. Linhas de Tendência Projetadas (Verde/Vermelho Estendido)
- Desenhadas do pivot anterior para o atual e estendidas para o futuro.
- Verde: 🟢 Linhas de tendência de alta (a partir das mínimas).
- Vermelho: 🔴 Linhas de tendência de baixa (a partir das máximas).
- Mostra as 2 linhas de tendência mais recentes e ativas.
- Útil para detectar rompimentos ou respeitos de tendência.
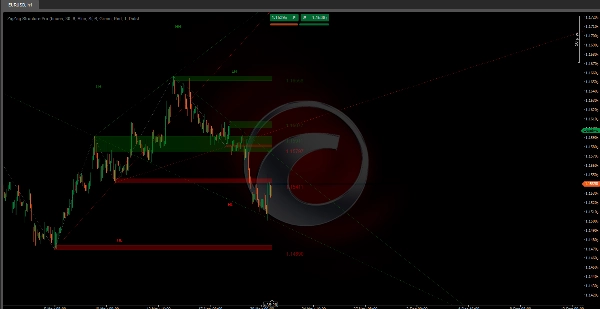
4. Rótulos de Estrutura de Mercado 🏷️
Cada pivot mostra um rótulo indicando sua classificação:
- HH (Higher High): ↗️ Máxima mais alta - Continuação de alta.
- LH (Lower High): ⬆️ Máxima mais baixa - Possível reversão de baixa.
- HL (Higher Low): ⬇️ Mínima mais alta - Possível reversão de alta.
- LL (Lower Low): ↘️ Mínima mais baixa - Continuação de baixa.
Lógica por trás do algoritmo 🧠
O indicador usa um algoritmo zigzag adaptativo que:
- Escaneia o preço procurando máximas e mínimas dentro de um período configurável (padrão 34 barras).
- Filtra movimentos insignificantes através de um limite mínimo de desvio (padrão 6 pips).
- Valida cada pivot assegurando que representa uma mudança real na estrutura do mercado.
- Compara estruturas entre pivots consecutivos para classificar o tipo de movimento.
- Atualiza dinamicamente as zonas à medida que novos pivots aparecem, removendo os mais antigos.
Configurações Principais ⚙️
- Barras de Retrospectiva do Pivot: Controla a sensibilidade do detector de pivots (menor = mais pivots, maior = apenas pivots principais).
- Filtro de Desvio de Preço: Filtro de ruído - movimentos menores que este valor são ignorados.
- Máximo de Zonas Visíveis: Número de níveis históricos que permanecem visíveis (de 1 a 20).
- Tipo de Exibição da Zona: Escolha entre retângulos (zonas completas) ou linhas simples.
- Mostrar Linhas de Tendência Estendidas: Ativar/desativar projeções de tendência.
Guia Rápido de Parâmetros 📖
Barras de Retrospectiva do Pivot (Padrão: 30)
- ↑ Aumentar (40-100): MENOS pivots, mais importantes. Para swing trading.
- ↓ Diminuir (15-25): MAIS pivots, mais sinais. Para scalping/day trading.
Filtro de Desvio de Preço (Padrão: 6)
- ↑ Aumentar (8-15): Filtra ruído, apenas grandes movimentos. Menos sinais, maior qualidade.
- ↓ Diminuir (2-5): Mais sensível, captura pequenos movimentos. Mais sinais.
Máximo de Zonas Visíveis (Padrão: 6)
- ↑ Aumentar (10-20): Mais níveis históricos visíveis. Para análise profunda.
- ↓ Diminuir (2-4): Apenas níveis recentes. Gráfico limpo.
Limite Histórico de Pivot (Padrão: 200)
- ↑ Aumentar (300-500): Mais histórico para cálculos. Análise de longo prazo.
- ↓ Diminuir (50-150): Apenas estrutura recente. Melhor desempenho.
Contagem de Projeções Ativas (Padrão: 5)
- ↑ Aumentar (5-10): Mais linhas de tendência projetadas.
- ↓ Diminuir (1-2): Apenas tendências dominantes. Mais clareza.
Mostrar Linhas de Tendência Estendidas (Sim/Não)
- Ativado: Projeta tendências para o futuro.
- Desativado: Apenas zigzag histórico.
🎯 Configurações Rápidas
- Scalping: Retrospectiva 15-20 | Desvio 3-5 | Zonas 3-4
- Day Trading: Retrospectiva 25-35 | Desvio 6-8 | Zonas 5-6
- Swing Trading: Retrospectiva 40-60 | Desvio 10-15 | Zonas 8-12
Resumo
Key features include:
- Support and resistance zones displayed as rectangles, with green zones marking support (significant lows) and red zones marking resistance (significant highs). These zones are projected forward to show current active levels.
- Connection lines linking pivots to form a clear zigzag pattern, illustrating trend direction and structure.
- Projected trend lines extended into the future, color-coded green for bullish trends and red for bearish trends, highlighting recent active trends and potential breakout or respect points.
- Configurable settings such as pivot lookback period, price deviation filter to reduce noise, maximum visible zones, and option to enable or disable extended trendline projections.
This indicator supports analysis across various markets including Forex, stocks, commodities, indices, and cryptocurrencies. It is suitable for different trading styles, from scalping and day trading to swing trading, by adjusting sensitivity parameters accordingly.
Avaliações de clientes
5 | 0 % | |
4 | 100 % | |
3 | 0 % | |
2 | 0 % | |
1 | 0 % |


