
Descrição
Indicador Aprimorado de Suporte e Resistência
Desbloqueie o poder da análise técnica com nosso Indicador Aprimorado de Suporte e Resistência para cAlgo. Esta ferramenta avançada foi projetada para ajudar os traders a identificar e visualizar níveis críticos de suporte e resistência em seus gráficos de negociação, aprimorando a tomada de decisões e estratégias de trading.
Principais Recursos:
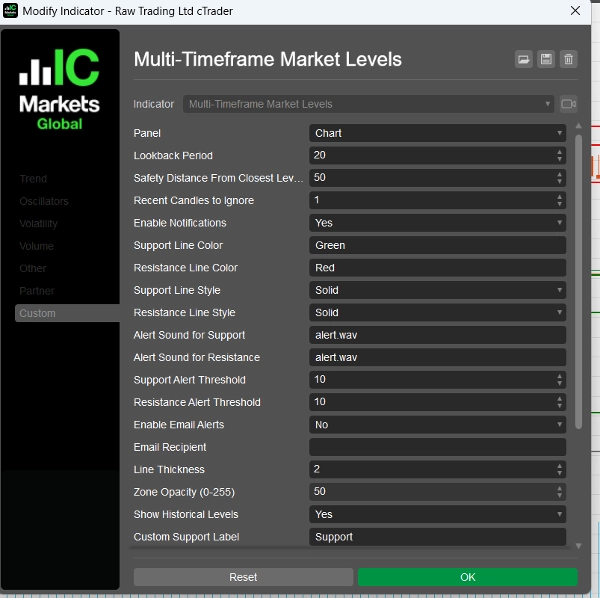
- Parâmetros Personalizáveis: Ajuste o indicador ao seu estilo de negociação com configurações ajustáveis, incluindo períodos de retrocesso, distâncias de segurança, sons de alerta e mais.
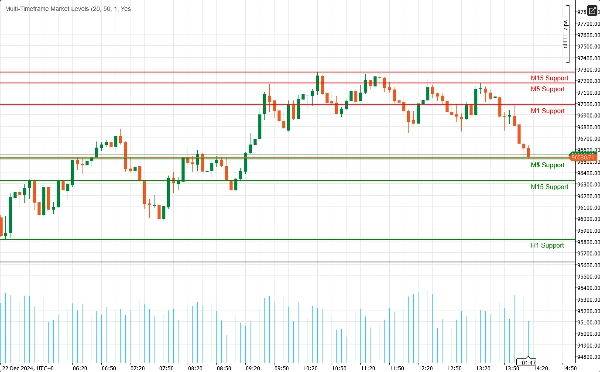
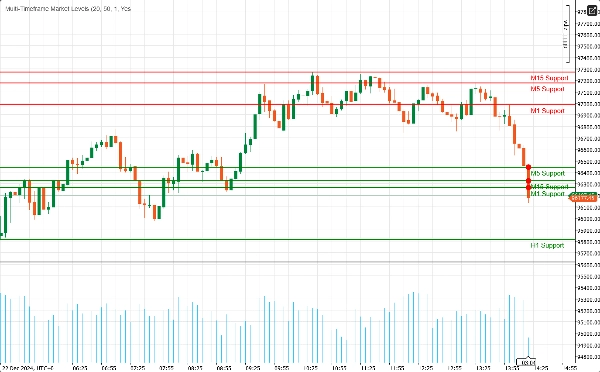
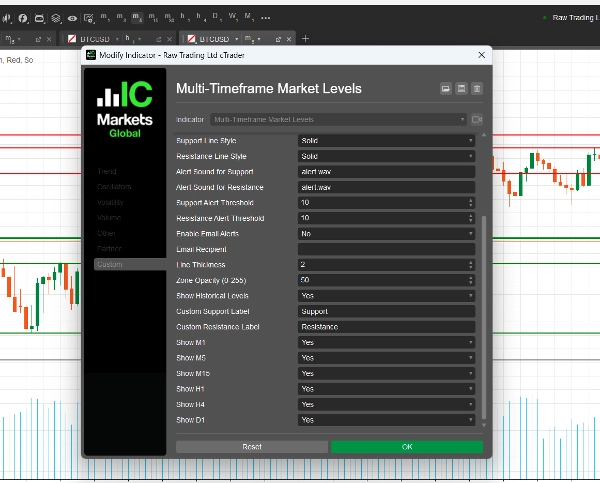
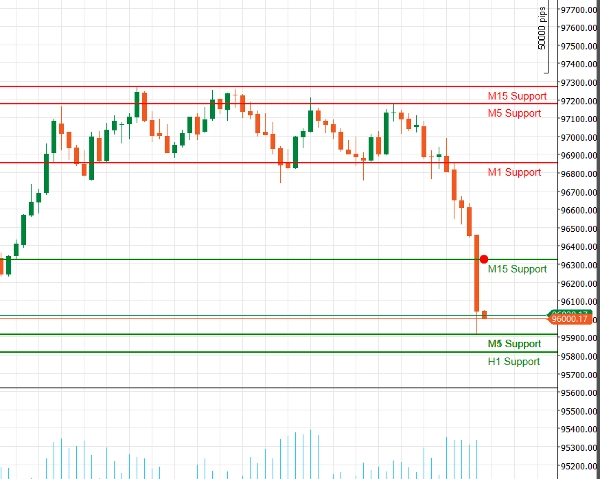
- Suporte Multi-Temporal: Analise múltiplos períodos simultaneamente (M1, M5, M15, H1, H4, D1) para obter uma visão abrangente da dinâmica do mercado e identificar níveis-chave em diferentes horizontes de negociação.
- Alertas em Tempo Real: Mantenha-se informado com notificações instantâneas! O indicador pode enviar alertas sonoros e notificações por e-mail quando o preço se aproxima de níveis críticos de suporte ou resistência, garantindo que você nunca perca uma oportunidade de negociação.
- Clareza Visual: Desfrute de representações visuais claras dos níveis de suporte e resistência, completas com cores e estilos de linha personalizáveis. Zonas destacadas fornecem contexto adicional, facilitando a identificação de pontos potenciais de reversão.
- Integração com Fibonacci: Aprimore sua análise com desenho integrado de níveis de Fibonacci, permitindo identificar potenciais níveis de retração e extensão em conjunto com suporte e resistência.
- Interface Amigável: Projetado tanto para traders iniciantes quanto experientes, o indicador é fácil de configurar e se integra perfeitamente ao seu ambiente cAlgo existente.
Como Usar o Indicador Aprimorado de Suporte e Resistência
- Instalação:
-
- Baixe o indicador e importe-o para sua plataforma cAlgo.
- Anexe o indicador ao gráfico desejado.
- Configurar Parâmetros:
-
- Ajuste as configurações para adequar ao seu estilo de negociação. Defina o período de retrocesso, distância de segurança e escolha suas cores e estilos de linha preferidos para os níveis de suporte e resistência.
- Ative as notificações se desejar receber alertas quando o preço se aproximar desses níveis.
- Selecionar Timeframes:
-
- Escolha quais timeframes deseja exibir. Você pode optar por mostrar ou ocultar níveis de M1, M5, M15, H1, H4 e D1, dependendo da sua estratégia de negociação.
- Analisar o Gráfico:
-
- Observe os níveis de suporte e resistência desenhados no seu gráfico. Esses níveis indicam onde o preço provavelmente irá reverter ou consolidar.
Como Negociar com o Indicador Aprimorado de Suporte e Resistência
- Identificando Pontos de Entrada:
-
- Operações Longas: Procure oportunidades de compra quando o preço se aproximar de um nível de suporte, especialmente se mostrar sinais de recuperação (ex.: padrões de velas de alta).
- Operações Curtas: Considere vender quando o preço se aproximar de um nível de resistência, particularmente se houver sinais de baixa (ex.: padrões de velas de baixa).
- Usando Alertas:
-
- Utilize os alertas em tempo real para notificá-lo quando o preço se aproximar de níveis-chave de suporte ou resistência. Isso permite agir rapidamente e aproveitar oportunidades potenciais de negociação.
- Combinando com Outros Indicadores:
-
- Aprimore sua estratégia combinando o Indicador Aprimorado de Suporte e Resistência com outros indicadores técnicos (ex.: Médias Móveis, RSI, MACD) para confirmar sinais e melhorar a precisão das suas operações.
- Definindo Níveis de Stop-Loss e Take-Profit:
-
- Coloque ordens de stop-loss logo abaixo dos níveis de suporte para operações longas e logo acima dos níveis de resistência para operações curtas para gerenciar o risco.
- Defina metas de take-profit no próximo nível significativo de suporte ou resistência para maximizar os ganhos potenciais.
Por Que Escolher o Indicador Aprimorado de Suporte e Resistência?
Navegar pelas complexidades dos mercados financeiros pode ser desafiador. O Indicador Aprimorado de Suporte e Resistência oferece as ferramentas necessárias para identificar níveis-chave de preço e tomar decisões de negociação informadas. Seja você um trader diário ou um investidor de longo prazo, este indicador é uma adição essencial ao seu conjunto de ferramentas de negociação.
Resumo
Avaliações de clientes
5 | 100 % | |
4 | 0 % | |
3 | 0 % | |
2 | 0 % | |
1 | 0 % |


