

Descrição
🧠 Indicador RSI Avançado – Análise Precisa de Momentum
Obtenha uma Compreensão Mais Profunda das Tendências do Mercado com um RSI Mais Inteligente
O Indicador RSI Avançado é uma poderosa evolução da ferramenta clássica RSI, desenvolvida para traders que valorizam precisão e filtragem inteligente de sinais. Com suavização algorítmica avançada, zonas adaptativas e detecção integrada de divergência, esta ferramenta oferece uma análise refinada de momentum para todos os mercados e prazos.
🔍 Principais Características:
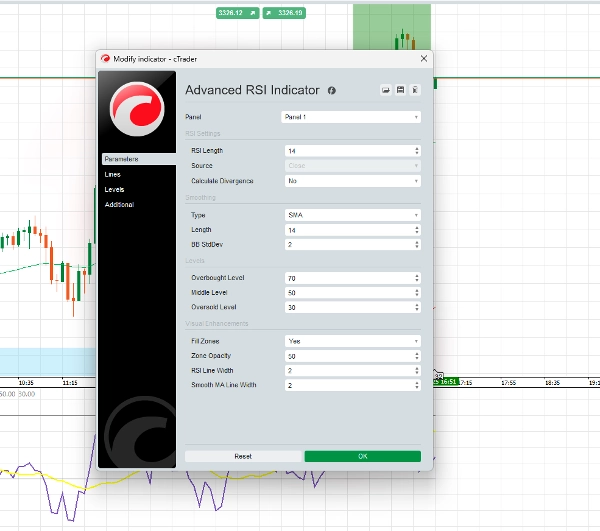
✅ Curva RSI Suavizada
Reduz movimentos irregulares e sinais falsos para insights mais claros sobre as tendências do mercado.
✅ Zonas de Sinal Adaptativas
Vai além dos níveis tradicionais 70/30 com limites dinâmicos que respondem à volatilidade do mercado.
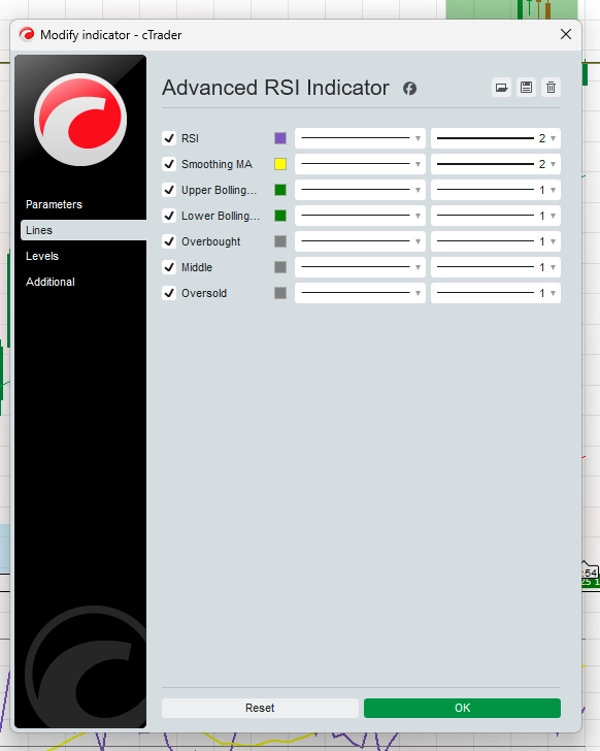
✅ Zonas de Momentum Codificadas por Cor
Avalie rapidamente o momentum de alta ou baixa com um design visual intuitivo.
✅ Alertas de Divergência
Destaca configurações de divergência de alta e baixa para apoiar a tomada de decisões estratégicas.
✅ Sistema de Alertas Personalizado
Configure alertas para cruzamentos de níveis RSI e sinais de divergência para nunca perder momentos-chave.
✅ Multi-Ativo, Multi-Temporalidade
Otimizado para uso em forex, cripto, ações, índices e mais — de gráficos M1 a diários.
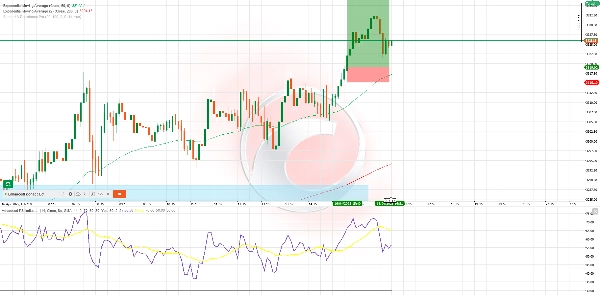
⚙️ Exemplo de Estratégia – RSI Wave Ride
Melhor para: operações swing H1 & H4
Indicadores usados: RSI Avançado, 50 EMA, 200 EMA
Exemplo de Compra:
- Preço está acima das EMAs 50 & 200
- RSI cai abaixo de 40 e começa a subir
- Aparece a cor de momentum de alta
- (Opcional) Divergência de alta detectada
- Entrada: Fechamento do candle acima do sinal
- SL: Abaixo da última mínima do swing
- TP: 1,5x–2x o risco ou resistência recente
Exemplo de Venda:
- Preço está abaixo das EMAs 50 & 200
- RSI sobe acima de 60, depois começa a cair
- Cor de momentum de baixa confirma a direção
- (Opcional) Divergência de baixa adiciona força
- Entrada: Fechamento do candle de confirmação
- SL: Acima da última máxima do swing
- TP: 1,5x–2x o risco ou suporte recente
💬 Por Que os Traders Escolhem Esta Ferramenta:
- Fácil de usar, mas poderosa
- Sinais que não se redesenham
- Testada nos principais mercados
- Pode ser usada sozinha ou junto com outras estratégias
Resumo
Avaliações de clientes
5 | 100 % | |
4 | 0 % | |
3 | 0 % | |
2 | 0 % | |
1 | 0 % |


