Descrição
BUBBLEXRAY — O RAIO-X DEFINITIVO DE VOLUME DE BOLHAS PARA CTRADER (VERSÃO 🇧🇷 ABAIXO)
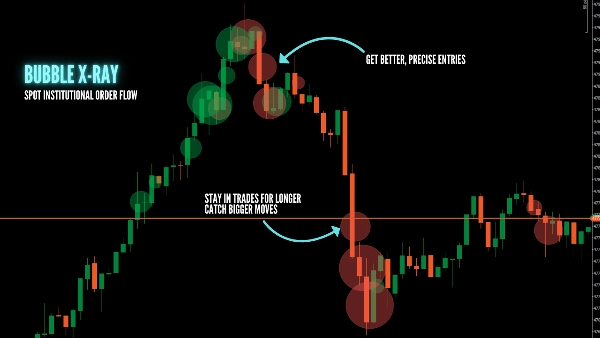
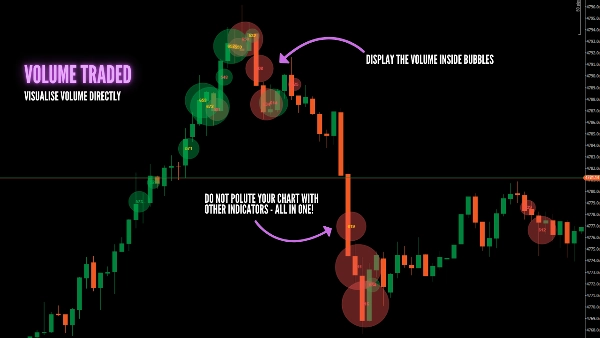
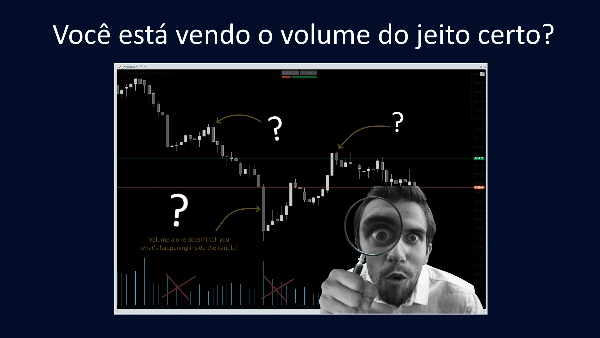
Identifique onde o dinheiro real se move. BubbleXRay identifica picos de alto volume e os representa como bolhas proporcionais diretamente na sua ação de preço. Exiba a variação acumulada do delta de volume (CVD) integrada em um único indicador, sem sobrecarregar ou poluir seu gráfico. Chega de suposições—veja as pegadas institucionais no momento em que acontecem.
✅ POR QUE USAR O BUBBLEXRAY?
- Picos de Atividade Instantâneos: As bolhas se formam no segundo em que uma barra de alto volume fecha.
- Pegadas Institucionais: Bolhas grandes em níveis-chave revelam onde grandes players estão ativos.
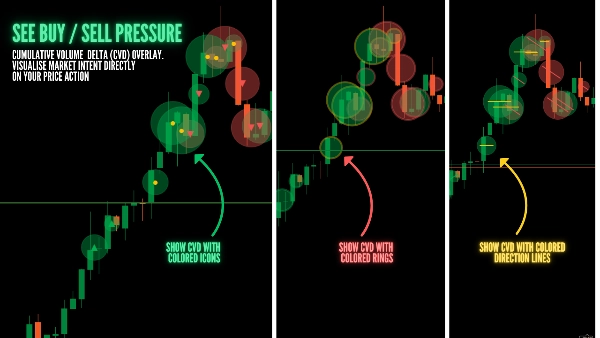
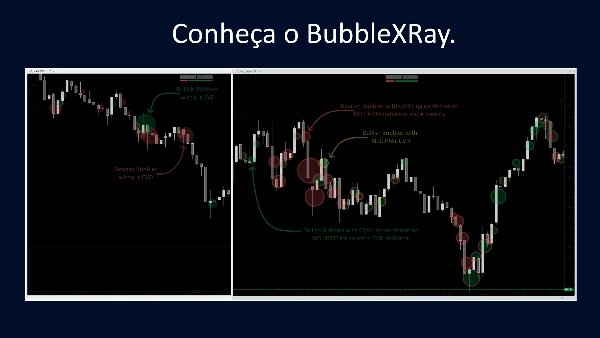
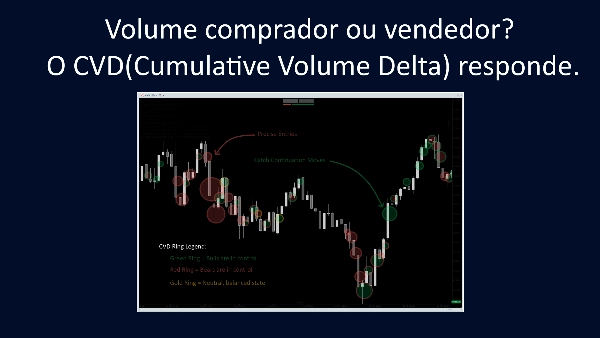
- Inteligência CVD: O Delta de Volume Acumulado integrado mostra se o surto foi pressão de Compra ou Venda.
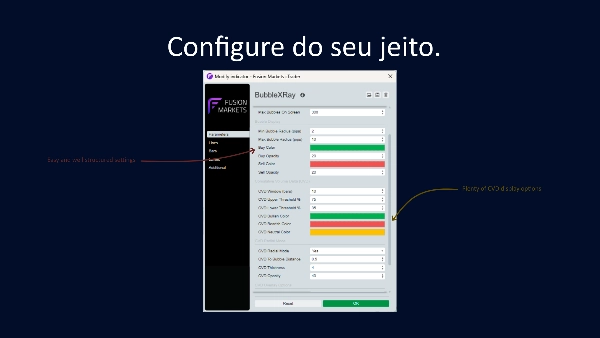
- Autoajuste: A janela percentual móvel se adapta a qualquer condição de mercado (Tendência ou Lateral).
- Ancorado ao Preço: O volume é mostrado no nível exato do preço, não escondido em um histograma em subpainel.
Exemplo de Predefinição: Ouro (XAUUSD) - Gráfico 1M
- Limite Percentil de Volume: 80
- Janela Percentil (barras): 250
- Máximo de Bolhas na Tela: 20
- Raio Mínimo das Bolhas (pips): 5
- Raio Máximo das Bolhas (pips): 20
- Período Móvel CVD (barras): 10
- Retrospectiva da Inclinação CVD (barras): 7
- Fator Plano CVD: 1.8
- Modo Radial CVD: Não
- Distância CVD para Bolha: 0.5
- Espessura CVD: 4
- Opacidade CVD: 40
- Opções de Sobreposição CVD: Não
- Modo de Depuração: Não
📺 ASSISTA AO TUTORIAL E JUNTE-SE À COMUNIDADE:
(Por favor, poste suas perguntas/pedidos de suporte nos comentários do vídeo para ajudar nossa comunidade a crescer!)
🛠️ RECURSOS PRINCIPAIS:
- Dimensionamento Proporcional: O tamanho da bolha escala linearmente com a magnitude do volume.
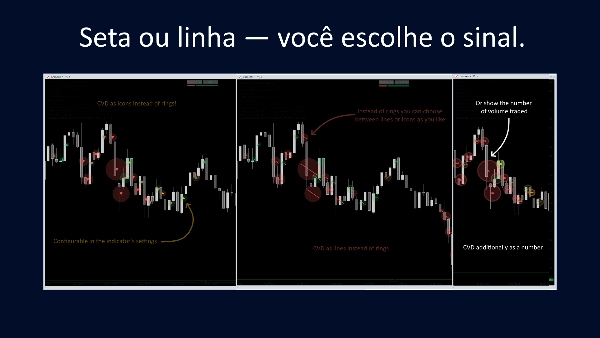
- Confirmação Dupla: Combine o Anel Radial e a Seta de Sobreposição para um contexto mais profundo do CVD.
- Configuração Zero: Seleciona automaticamente o melhor timeframe da fonte de dados para seu gráfico.
- Interface Limpa: Opacidade configurável e limites de exibição para manter seus gráficos profissionais.
🇧🇷 BUBBLEXRAY — O RAIO-X DE VOLUME DEFINITIVO PARA CTRADER
Identifique onde o "Smart Money" está atuando. O BubbleXRay marca picos de alto volume com bolhas proporcionais diretamente no preço. Exiba a variação acumulada do volume (CVD) integrada em um único indicador, sem sobrecarregar ou poluir seu gráfico.Chega de dúvidas: veja o rastro institucional no momento em que ele ocorre.
✅ POR QUE USAR O BUBBLEXRAY?
- Picos de Atividade Instantâneos: As bolhas surgem assim que uma barra de alto volume fecha.
- Rastros Institucionais: Bolhas grandes em níveis-chave revelam a atuação de grandes players.
- Inteligência CVD: O Delta de Volume Acumulado integrado mostra se a pressão foi de Compra ou Venda.
- Auto-Ajustável: O sistema de percentil se adapta a qualquer mercado (Tendência ou Lateralização).
- Ancorado ao Preço: O volume é exibido no nível exato da ação, não escondido em histogramas inferiores.
📺 ASSISTA AO TUTORIAL E TIRE SUAS DÚVIDAS:
(Por favor, poste suas dúvidas e pedidos de suporte nos comentários do vídeo acima, assim ajudamos ao máximo de pessoas!)
🛠️ DESTAQUES TÉCNICOS:
- Tamanho Proporcional: O raio da bolha escala conforme a magnitude do volume.
- Confirmação Dupla: Use o Anel Radial e a Seta Interna para um contexto profundo de CVD.
- Configuração Zero: Seleciona automaticamente o melhor timeframe de dados para seu gráfico.
- Interface Limpa: Opacidade e limites de exibição configuráveis para manter seu setup profissional.
Resumo
Avaliações de clientes
5 | 0 % | |
4 | 100 % | |
3 | 0 % | |
2 | 0 % | |
1 | 0 % |