

Beschreibung
Indikator der Kerzen in Echtzeit basierend auf der Marktstruktur einfärbt und Liquiditätszonen, institutionelle Flüsse und Konsolidierungsbereiche zeichnet. Entwickelt für Trader, die nach den Smart Money Concepts (SMC) Prinzipien handeln.
🧠 Algorithmus-Logik
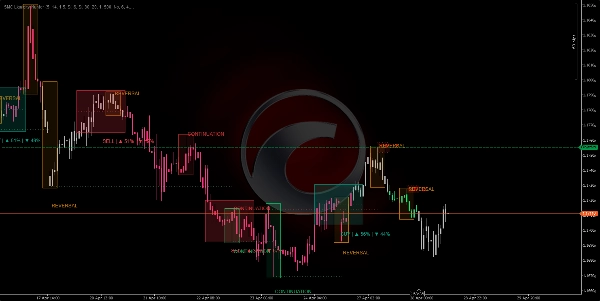
https://chartshots.spotware.com/c/69f0e3fd81319
1. Markstruktur-Erkennung 🔍
- Findet Wendepunkte (lokale Hochs und Tiefs) unter Verwendung eines konfigurierbaren Rückblickzeitraums.
- Vergleicht aufeinanderfolgende Wendepunkte um die Struktur zu bestimmen:
-
- Höhere Hochs + höhere Tiefs = bullische Tendenz 📈
- Niedrigere Hochs + niedrigere Tiefs = bärische Tendenz 📉
- Gemischte Signale = neutrale Tendenz ➡️
- Filtert Rauschen: zählt nur Wendepunkte, die über eine Schwelle hinausgehen, basierend auf ATR (Average True Range) multipliziert mit einstellbarer Empfindlichkeit.
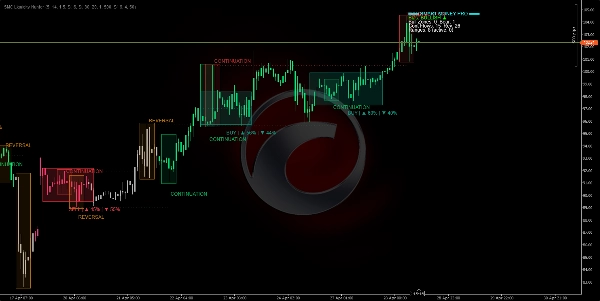
https://chartshots.spotware.com/c/69f0e7e752b74
2. Institutionelle Flüsse (Flow Boxes) 🔄
- Jedes Mal, wenn ein neuer signifikanter Wendepunkt entsteht, zeichnet der Algorithmus eine horizontale Linie vom vorherigen Wendepunkt zum neuen.
- Klassifiziert den Fluss als:
-
- Fortsetzung: Preis respektiert den Trend (HL im Aufwärtstrend, LH im Abwärtstrend) ✅
- Umkehr: Preis durchbricht die Struktur (LL im Aufwärtstrend, HH im Abwärtstrend) ⚠️
- Zeichnet eine farbige Box um den Wendepunkt mit der Beschriftung "FORTSETZUNG" oder "UMKEHR".
3. Angebots-/Nachfragezonen (Liquidität) 💧
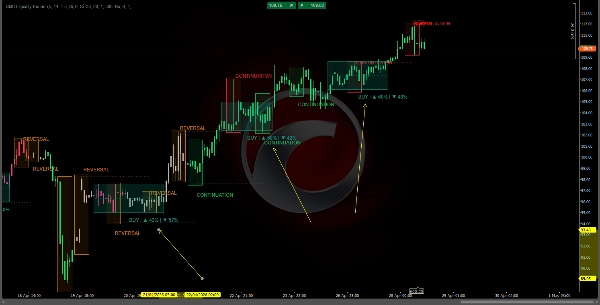
https://chartshots.spotware.com/c/69f0e8e7aef29
- Um jeden signifikanten Wendepunkt wird ein horizontaler Bereich gezeichnet, der sich für eine konfigurierbare Anzahl von Bars in die Zukunft erstreckt.
- Diese Zonen repräsentieren nicht ausgeführte institutionelle Aufträge:
-
- Bärische Wendepunkte → ANGEBOTSzone (Verkaufsaufträge) 🔴
- Bullische Wendepunkte → NACHFRAGEzone (Kaufaufträge) 🟢
- Eine Zone bricht zusammen und verschwindet wenn der Preis sie mit genügend Kraft durchdringt oder wenn ihre Lebensdauer abläuft.
4. Bereichserkennungs-Engine (Konsolidierungen) 📦
- Berechnet einen einfachen gleitenden Durchschnitt (SMA) mit einem ATR-Band darum herum.
- Wenn jeder einzelne Balken innerhalb eines Rückblickfensters im Band bleibt, erkennt der Algorithmus einen Konsolidierungsbereich.
- Zeichnet ein blaues Rechteck mit:
-
- gepunktete Mittellinie (Bereichsgleichgewicht) ⚖️
- Ausbruchswahrscheinlichkeits-Prozentsatz bullisch/bärisch basierend auf:
-
- Richtungs-Momentum (ADX/DI+ vs DI-) 📐
- Kumuliertes bullisches vs bärisches Volumen innerhalb des Bereichs 📊
- Verweildauer in oberer vs unterer Hälfte ⏱️
5. Kerzenfärbung (sauber & visuell) 🕯️
- Grüne Kerze = bestätigte bullische Struktur (HH+HL) 🟢
- Magenta/rote Kerze = bestätigte bärische Struktur (LH+LL) 🔴
- Graue Kerze = neutrale oder Übergangsphase ⚪
- Keine überlappenden Rechtecke: echte Dochte und Körper sind jederzeit vollständig sichtbar.
📋 Dashboard (Ecke)
Numerische Zusammenfassung aktiver Zonen, Flüsse & Bereiche
🛠️ Wie man es benutzt
⚙️ Empfohlene Einstellungen
- Zeitrahmen: H1 oder höher (ideal für Smart Money).
- Standardparameter: funktionieren gut für Forex, Indizes und Krypto.
- Empfindlichkeit anpassen: erhöhen für volatile Märkte, verringern für unruhige Seitwärtsmärkte.
📗 Handelsregeln :
✅ Long-Einstieg (KAUF)
- Kerzen müssen grün sein (bullische Tendenz aktiv) 🟢
- Preis berührt oder nähert sich einer aktiven "NACHFRAGE" Zone 🟢
- Eine "FORTSETZUNGS"-Box (nicht "UMKEHR") erscheint in dieser Zone ✅
- Dashboard zeigt bullische Ausbruchswahrscheinlichkeit > 60% im aktiven Bereich (falls vorhanden) 📊
✅ Short-Einstieg (VERKAUF)
- Kerzen müssen magenta/rot sein (bärische Tendenz aktiv) 🔴
- Preis berührt oder nähert sich einer aktiven "ANGEBOTS" Zone 🔴
- Eine "FORTSETZUNGS"-Box (nicht "UMKEHR") erscheint in dieser Zone ✅
- Dashboard zeigt bärische Ausbruchswahrscheinlichkeit > 60% 📊
❌ Nicht handeln, wenn...
- Kerzen grau sind (keine definierte Tendenz) ⚪
- Ein "UMKEHR" Signal genau dort erscheint, wo Sie gerade einsteigen wollten ⚠️
- Preis innerhalb eines blauen Bereichs ist, ohne klaren Ausbruch 🔵
- Dashboard zeigt entgegengesetzte Konfluenz (bärische Konfluenz bei bullischem Setup oder umgekehrt) 🔄
📈 Dashboard-Interpretation
text
═══ SMART MONEY PRO ═══
Tendenz: BULLISCH ▲ ← Aktuelle Markttendenz
Bullische Zonen: 2 Bärische: 1 ← Aktive Liquiditätszonen
Fortsetzungsflüsse: 3 Umkehr: 0 ← Fortsetzungen vs Umkehrungen
Bereiche: 4 (aktiv: 1) ← Gesamt- und aktive Bereiche
Aktiver Bereich ▲65% ▼35% ← Ausbruchswahrscheinlichkeit
⚡ BULLISCHE KONFLUENZ ← Maximales Ausrichtungssignal
💡 Schlüsselprinzipien
- ✅ Kein Repainting: alles wird nur mit geschlossenen Balkendaten berechnet.
- ✅ Sauberes Chart: farbige echte Kerzen, halbtransparente Zonen, keine visuelle Unordnung.
- ✅ Strukturvorschau: Kerzenfarbe zeigt die Marktphase, bevor Wendepunkte offensichtlich sind.
- ✅ Eingebaute Konfluenz: wenn aktive Zone + aktiver Bereich + Flusssignal alle übereinstimmen, weist das Dashboard explizit darauf hin.
Zusammenfassung
Key features include:
- **Institutional Flows:** Draws horizontal lines and colored boxes between significant pivots, labeling flows as "CONTINUATION" or "REVERSAL" to indicate trend respect or break.
- **Supply and Demand Zones:** Highlights unexecuted institutional orders with horizontal bands around pivots, distinguishing supply (sell) and demand (buy) zones that expire or break upon price penetration.
- **Range Detection:** Identifies consolidation ranges using an SMA with ATR bands, marking them with blue rectangles and providing breakout probability percentages based on momentum, volume, and time distribution.
- **Dashboard:** Displays numeric summaries of active zones, flows, ranges, and breakout probabilities, including confluence signals when multiple factors align.
Recommended for use on H1 or higher timeframes, the indicator suits Forex, indices, and cryptocurrencies. It operates without repainting by relying on closed bar data and maintains a clean chart presentation with visible candle wicks and bodies.
Diskussion
Kundenbewertungen
5 | 50 % | |
4 | 25 % | |
3 | 0 % | |
2 | 25 % | |
1 | 0 % |














![„[Hamster-Coder] Pivot Points MTF“-Logo](https://cdn.ctrader.com/image/webp/4c143e5a-309c-40e3-a578-f04d1e133ffa_31159)















