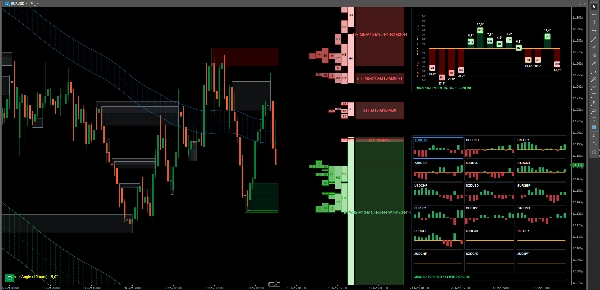

Description
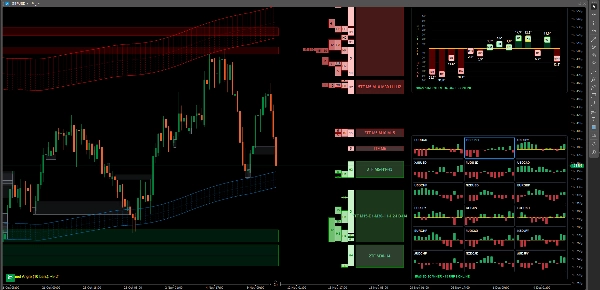
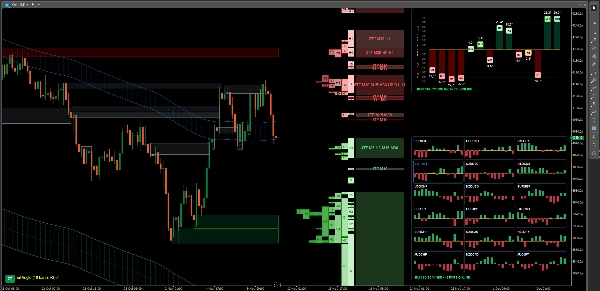
SMAS Structure Balance is the flagship analytical module of the SMAS 3D (Shved Market Analysis System) ecosystem by Andrey Shvedov (MrShved), author of the legendary classic "Shved Supply and Demand".
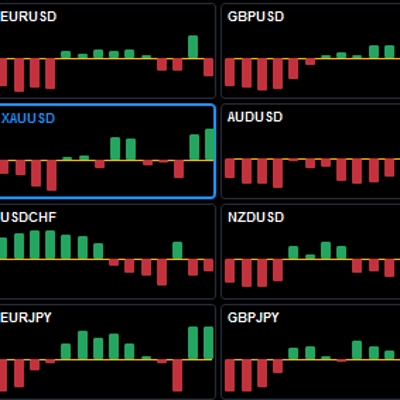
The indicator implements a quantum shift from the standard Price Domain into the discrete Event Domain. It simultaneously scans 14 quantized timeframes (including hidden synthetic slices: M2, M3, M10, H2, H3), calculating the true vector and mathematical slope of the market structure.
==============================================
KEY FEATURES & ALPHA-EDGE
==============================================
• Predictive Lead Effect: Real-time monitoring of micro- and macro-structure phase desynchronization detects stealth institutional volume flow, forecasting major higher-timeframe reversals 8–9 hours before they appear on standard charts.
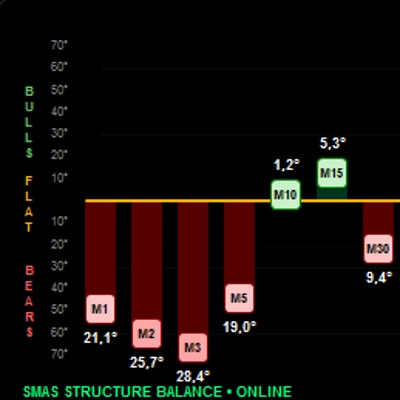
• Phase 3D Telemetry: Quantifies the balance of power between buyers (Bulls) and sellers (Bears) in exact degrees of slope (°) or relative percentage (%).
• 4-Tier Power Gradient: Dynamic color tiers indicate the strength of price momentum from minor pullbacks to climactic expansion.
• Dynamic Auto-Scale (Auto-Zoom): Automatically adapts column height to current symbol volatility.
==============================================
HOW TO INTERPRET SIGNALS
==============================================
1. Unified Impulse (Trend): The majority of timeframes are aligned in one direction with increasing angle/power (e.g., 10 out of 14 TFs in the BEARS zone with angles > 25°) — execute trades strictly with trend momentum.
2. Spring Compression (Reversal Pattern): Lower timeframes (M1–M15) show deep exhaustion (Bears), while the macro foundation (H4–W1) remains firmly positive (Bulls). When lower TFs cross back into neutral/bullish, it offers a high-probability institutional long entry with minimal risk.
3. Market Equilibrium (Flat): Columns oscillate tightly around the yellow FLAT axis (angles < 5°) — warns of institutional liquidity accumulation prior to an explosive breakout.
==============================================
CORE SETTINGS
==============================================
• Smooth Period (10–200): Weight coefficient for structural polynomial smoothing.
• Calculation History Depth: Historical bar limit (recommended: 500–1500 bars).
• Show As Percentage: Toggle between angular degrees (Deg °) and relative percentage (%).
• Number of bars for angle: Lookback interval for slope vector calculation.
• UI & Dashboard Customization: Adjust card shapes (Circle/Rectangle), panel offset, grid colors, and background theme.
==============================================
WHO IS THIS FOR?
==============================================
• Smart Money Concepts (SMC) & Supply/Demand (S&D) traders seeking true mathematical order flow confirmation.
• Scalpers & Day Traders wanting instant macro context without flipping multiple charts.
• Swing Traders hunting for structural trend exhaustions and institutional pivots.
Summary
Key features include a predictive lead effect for early reversal signals, a 3D phase telemetry measuring buyer-seller power balance in degrees or percentages, a 4-tier color-coded power gradient indicating momentum strength, and dynamic auto-scaling adapting to symbol volatility. The indicator supports customizable smoothing periods, calculation history depth, display modes, and user interface elements.
Interpretation guidelines highlight three main patterns: unified impulse trends across most timeframes, spring compression reversal patterns indicating institutional long entries, and market equilibrium phases signaling liquidity accumulation before breakouts.
SMAS Structure Balance is suited for traders employing Smart Money Concepts and Supply/Demand strategies, including scalpers, day traders, and swing traders seeking mathematical order flow confirmation and macro context without switching charts. It provides visualization outputs and supports signals such as cross, level touch, and level break based on bar data.