
Beschreibung
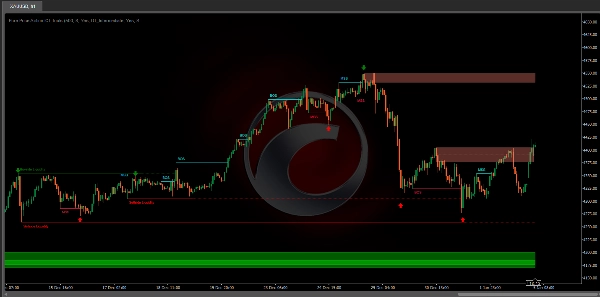
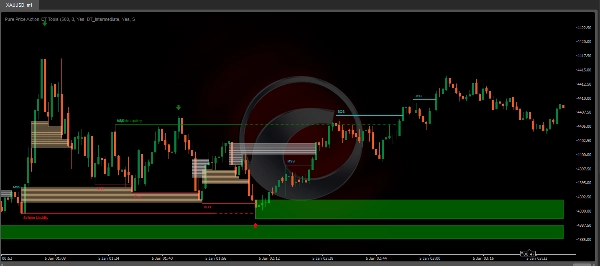
Der Pure Price Action ICT Tools Indikator ist für die reine Preisaktionsanalyse konzipiert und erkennt automatisch Echtzeit-Markstrukturen, Liquiditätsniveaus, Order- & Breaker-Blöcke sowie Liquiditätslücken.
Sein einzigartiges Merkmal liegt in der ausschließlichen Abhängigkeit von Preismustern, ohne durch benutzerdefinierte Eingaben eingeschränkt zu sein, was eine robuste und objektive Analyse der Marktdynamik gewährleistet.
Hauptmerkmale
- Marktstrukturen
Ein Market Structure Shift, auch bekannt als Change of Character (CHoCH), ist ein entscheidendes Ereignis in der Preisaktionsanalyse, das auf eine potenzielle Änderung der Marktstimmung oder -richtung hinweist. Ein MSS tritt auf, wenn der Preis von einem etablierten Trend umkehrt, was signalisiert, dass der vorherrschende Trend an Dynamik verlieren könnte und eine Umkehr im Gange sein könnte. Diese Verschiebung wird oft durch wichtige technische Muster identifiziert, wie ein höheres Tief in einem Abwärtstrend oder ein niedrigeres Hoch in einem Aufwärtstrend, die eine Schwächung der Stärke des aktuellen Trends anzeigen.
Ein Break of Structure deutet typischerweise auf die Fortsetzung des aktuellen Markttrends hin. Dieses Ereignis tritt ein, wenn der Preis entscheidend über ein vorheriges Swing-Hoch oder -Tief hinausgeht und die Stärke des vorherrschenden Trends bestätigt. In einem Aufwärtstrend wird ein BOS durch das Überschreiten eines vorherigen Hochs markiert, während in einem Abwärtstrend das Unterschreiten eines vorherigen Tiefs identifiziert wird.
Während ein Market Structure Shift (MSS) auf eine potenzielle Trendwende hinweisen kann und ein Break of Structure (BOS) oft die Trendfortsetzung bestätigt, garantieren sie keine vollständige Umkehr oder Fortsetzung. MSS- und BOS-Niveaus können auch als Liquiditätszonen oder Bereiche der Preis-Konsolidierung fungieren, anstatt definitiv eine Änderung der Marktrichtung anzuzeigen. Händler sollten diese Signale vorsichtig interpretieren und sie mit zusätzlichen Faktoren validieren, bevor sie Handelsentscheidungen treffen. Für weitere Details zu anderen Komponenten des Tools verweisen wir auf die folgenden Abschnitte.
- Order- & Breaker-Blöcke
Order- und Breaker-Blöcke sind Schlüsselkonzepte in der Preisaktionsanalyse, die Händlern helfen, bedeutende Niveaus in der Marktstruktur zu identifizieren.
Order-Blöcke sind spezifische Preiszonen, in denen bedeutende Kauf- oder Verkaufsaktivitäten stattgefunden haben. Diese Zonen repräsentieren oft die Aktionen großer institutioneller Händler oder Market Maker, die erhebliche Aufträge ausführen, die den Markt beeinflussen.
Breaker-Blöcke sind spezifische Preiszonen, in denen eine starke Umkehr stattfindet, die zu einem Bruch der vorherrschenden Marktstruktur führt. Diese Blöcke zeigen Bereiche an, in denen der Preis auf erheblichen Widerstand oder Unterstützung gestoßen ist, was zu einer Umkehr führt.
Zusammenfassend bieten Kauf- und Verkaufsliquidität entscheidende Einblicke in die Dynamik von Marktangebot und -nachfrage und helfen Händlern, fundierte Entscheidungen basierend auf der Verfügbarkeit von Aufträgen auf verschiedenen Preisniveaus zu treffen.
- Kauf- & Verkaufsliquidität
Sowohl Kauf- als auch Verkaufsliquiditätszonen sind entscheidend, um potenzielle Wendepunkte im Markt zu identifizieren. Diese Zonen sind Bereiche, in denen bedeutendes Kauf- oder Verkaufsinteresse konzentriert ist und zukünftige Preisbewegungen beeinflusst.
Zusammenfassend bieten Kauf- und Verkaufsliquidität entscheidende Einblicke in die Dynamik von Marktangebot und -nachfrage und helfen Händlern, fundierte Entscheidungen basierend auf der Verfügbarkeit von Aufträgen auf verschiedenen Preisniveaus zu treffen.
- Liquiditätslücken
Liquiditätslücken sind Lücken oder Bereiche in einem Preischart, in denen es an Handelsaktivität mangelt. Diese Lücken stellen Zonen mit minimalen bis keinen Kauf- oder Verkaufsaufträgen dar, was oft zu starken Preisbewegungen führt, wenn der Markt diese Bereiche betritt.
Zusammenfassend sind Liquiditätslücken entscheidende Bereiche in einem Preischart, die durch einen Mangel an Handelsaktivität gekennzeichnet sind. Diese Lücken können zu schnellen Preisbewegungen und erhöhter Volatilität führen, was sie zu wichtigen Überlegungen für Händler bei ihrer Analyse und Entscheidungsfindung macht.
- Swing-Punkte
Umkehrpunkte im Preis werden häufig als Swing-Punkte bezeichnet. Händler analysieren oft historische Swing-Punkte, um Markttrends zu erkennen und potenzielle Ein- und Ausstiegspunkte für Trades zu bestimmen.
Beachten Sie, dass diese in diesem Skript rückwirkend gezeichnet werden, das heißt, sie befinden sich nicht an der Stelle, an der sie erkannt werden.
Die Erkennung von Swing-Punkten und das einzigartige Merkmal dieses Skripts basieren ausschließlich auf der Preisaktion, wodurch numerische benutzerdefinierte Einstellungen entfallen. Der Prozess beginnt mit der Erkennung kurzfristiger Swing-Punkte:
- Kurzfristiges Swing-Hoch (STH): Identifiziert als ein Preishoch, das von niedrigeren Hochs auf beiden Seiten umgeben ist.
- Kurzfristiges Swing-Tief (STL): Erkannt als ein Preistief, das von höheren Tiefs auf beiden Seiten umgeben ist.
Mittelfristige und langfristige Swing-Punkte werden mit demselben Ansatz, jedoch mit einer kleinen Modifikation erkannt. Anstatt direkt Preiskerzen zu analysieren, werden zuvor erkannte kurzfristige Swing-Punkte verwendet. Für mittelfristige Swing-Punkte werden kurzfristige Swing-Punkte analysiert, während für langfristige Swing-Punkte mittelfristige verwendet werden.
Diese Methode gewährleistet eine robuste und objektive Analyse der Marktdynamik und bietet Händlern verlässliche Einblicke in Marktstrukturen. Erkannte Swing-Punkte dienen als Grundlage für die Identifizierung von Marktstrukturen, Kauf- und Verkaufsliquiditätsniveaus sowie Order- und Breaker-Blöcken, die mit diesem Tool dargestellt werden.
Zusammenfassend sind Swing-Punkte wesentliche Elemente der technischen Analyse, die Händlern helfen, Trends, Unterstützungs- und Widerstandsniveaus sowie optimale Ein- und Ausstiegspunkte zu identifizieren. Das Verständnis von Swing-Punkten ermöglicht es Händlern, fundierte Entscheidungen basierend auf den natürlichen Preisbewegungen im Markt zu treffen.
Einstellungen
- Marktstrukturen
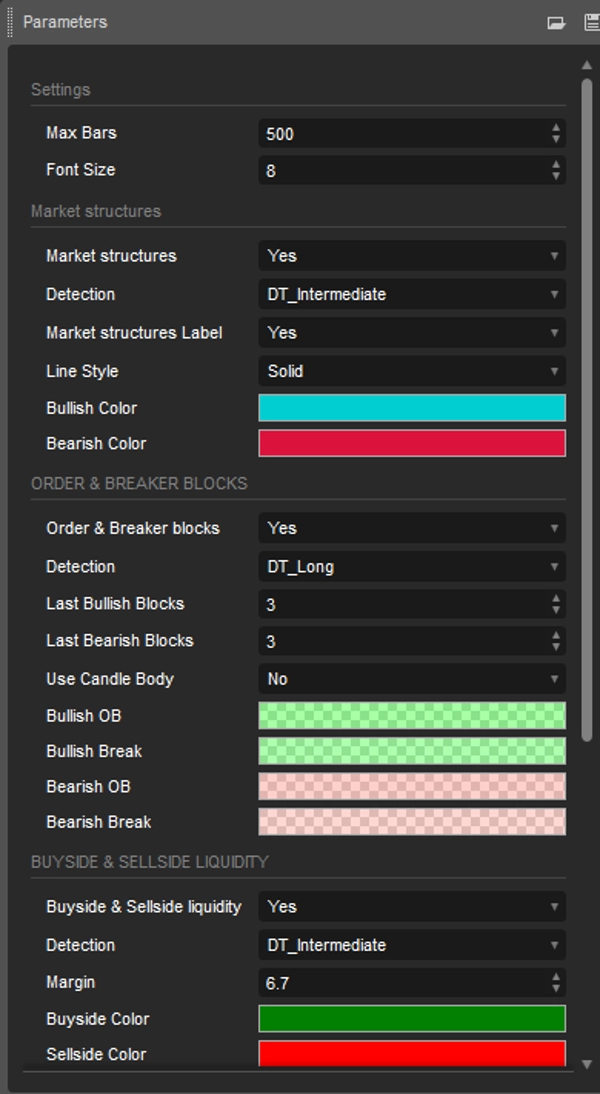
Marktstrukturen: Schaltet die Sichtbarkeit der Marktstrukturen, sowohl Verschiebungen als auch Brüche, ein oder aus.
Erkennung: Eine Option, die es Benutzern ermöglicht, Marktstrukturen basierend auf der Bedeutung von Swing-Niveaus zu erkennen, einschließlich kurzfristiger, mittelfristiger und langfristiger.
Marktstruktur-Labels: Steuert die Sichtbarkeit von Labels, die den Typ der Marktstruktur hervorheben.
Linienstil: Passt den Stil der Linien an, die die Marktstruktur darstellen.
- Order- & Breaker-Blöcke
Order- & Breaker-Blöcke: Schaltet die Sichtbarkeit der Order- & Breaker-Blöcke ein oder aus.
Erkennung: Eine Option, die es Benutzern ermöglicht, Order- & Breaker-Blöcke basierend auf der Bedeutung von Swing-Niveaus zu erkennen, einschließlich kurzfristiger, mittelfristiger und langfristiger.
Letzte bullische Blöcke: Anzahl der zuletzt angezeigten bullischen Order-/Breaker-Blöcke im Chart.
Letzte bärische Blöcke: Anzahl der zuletzt angezeigten bärischen Order-/Breaker-Blöcke im Chart.
Kerzenkörper verwenden: Ermöglicht es Benutzern, Kerzenkörper als Orderblock-Bereiche anstelle des gesamten Kerzenbereichs zu verwenden.
- Kauf- & Verkaufsliquidität
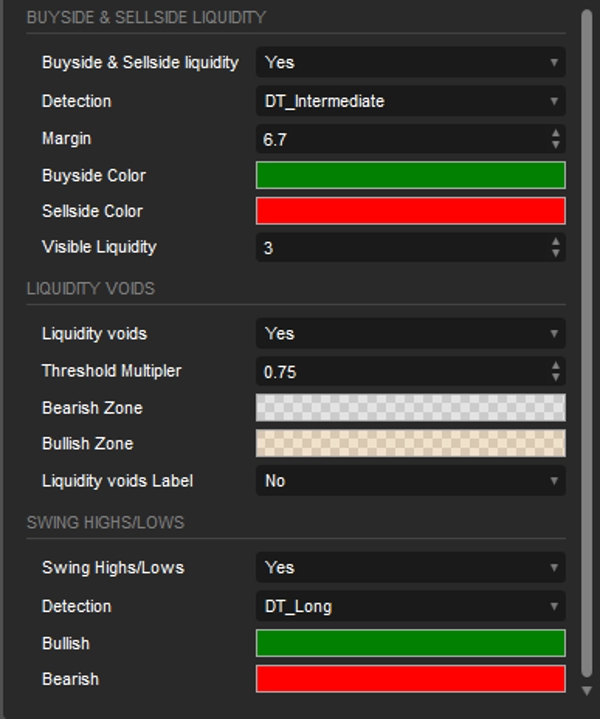
Kauf- & Verkaufsliquidität: Schaltet die Sichtbarkeit der Kauf- & Verkaufsliquiditätsniveaus ein oder aus.
Erkennung: Eine Option, die es Benutzern ermöglicht, Kauf- & Verkaufsliquidität basierend auf der Bedeutung von Swing-Niveaus zu erkennen, einschließlich kurzfristiger, mittelfristiger und langfristiger.
Rand: Legt den Rand/die Empfindlichkeit für die Erkennung eines Liquiditätsniveaus fest.
Sichtbare Liquidität: Steuert die Menge der zu visualisierenden Liquiditätsniveaus/-zonen.
- Liquiditätslücken
Liquiditätslücken: Aktiviert die Anzeige sowohl bullischer als auch bärischer Liquiditätslücken.
Schwellenmultiplikator: Definiert den Multiplikator für die Schwelle, die fest auf den ATR-Bereich von 200 Perioden codiert ist.
Label: Aktiviert die Anzeige eines Labels, das Liquiditätslücken anzeigt.
- Swing-Punkte
Swing-Hochs/-Tiefs: Schaltet die Sichtbarkeit der Swing-Niveaus ein oder aus.
Erkennung: Eine Option, die es Benutzern ermöglicht, Swing-Niveaus basierend auf der Bedeutung von Swing-Niveaus zu erkennen, einschließlich kurzfristiger, mittelfristiger und langfristiger.
Zusammenfassung
Key functionalities include:
- Market Structures: Detects Market Structure Shifts (potential trend reversals) and Breaks of Structure (trend continuations) based on price patterns.
- Order & Breaker Blocks: Highlights significant price zones where institutional buying/selling or strong reversals occur.
- Buy-side & Sell-side Liquidity: Identifies zones of concentrated buying or selling interest that may influence price movements.
- Liquidity Voids: Marks price chart gaps with minimal trading activity, often leading to sharp price moves.
- Swing Points: Detects short-, intermediate-, and long-term reversal points to aid in trend analysis and trade decision-making.
The tool offers customizable settings to toggle visibility and detection sensitivity for each feature, including options to adjust detection based on swing level significance and display preferences. It supports analysis across various markets such as Forex, Crypto (e.g., BTCUSD), and indices (e.g., NAS100, XAUUSD). The indicator provides an objective framework for analyzing market dynamics based solely on price action patterns.
Kundenbewertungen
5 | 67 % | |
4 | 0 % | |
3 | 33 % | |
2 | 0 % | |
1 | 0 % |


