
Beschreibung
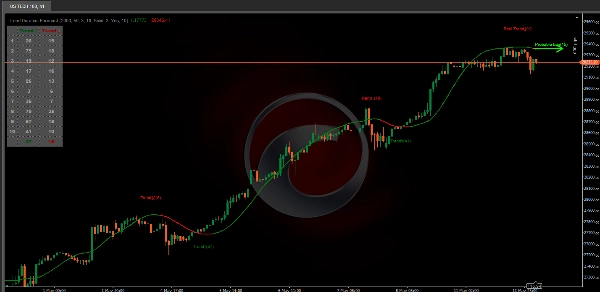
Der Trend Duration Forecast Indikator ist darauf ausgelegt, die wahrscheinliche Lebensdauer eines bullischen oder bärischen Trends zu schätzen. Mithilfe eines Hull Moving Average (HMA) zur Erkennung von Richtungswechseln verfolgt er die Dauer jedes historischen Trends und berechnet einen Durchschnitt, um vorherzusagen, wie lange der aktuelle Trend statistisch gesehen voraussichtlich andauern wird. Dies ermöglicht es Händlern, sowohl die Echtzeit-Trendstärke als auch potenzielle Erschöpfungszonen mit außergewöhnlicher Klarheit zu visualisieren.
WICHTIGE FUNKTIONEN
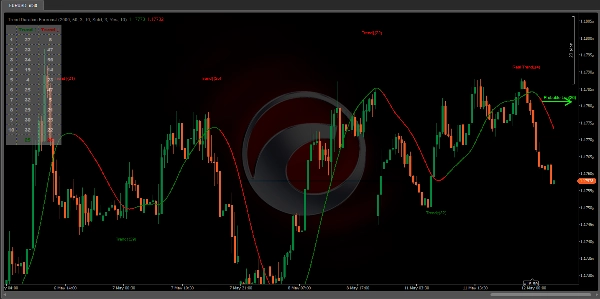
Dynamische Trend-Erkennung: Verwendet den Hull Moving Average, um zu erkennen, wann der Preis in einen neuen Aufwärts- oder Abwärtstrend übergeht.
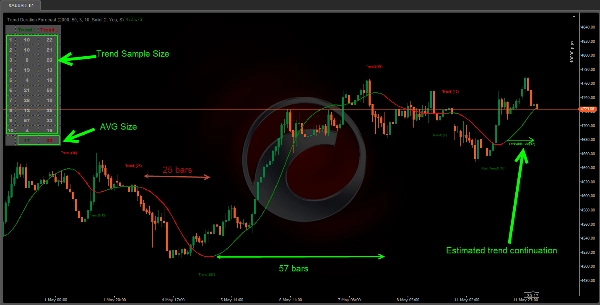
Trend-Dauer-Zählung: Misst die Anzahl der Balken in jeder abgeschlossenen bullischen und bärischen Phase, um die Trendbeständigkeit zu verstehen.
Prognose-Projektion: Projeziert automatisch eine geschätzte Trendfortsetzungslinie basierend auf der durchschnittlichen Länge der jüngsten Trends.
Echtzeit-Updates: Aktualisiert kontinuierlich das Label „Real Length“, während sich der Trend entwickelt
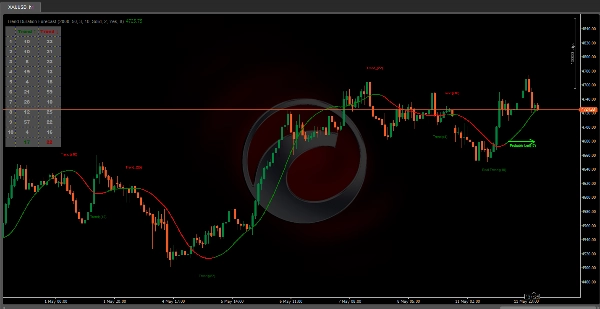
Historische Datentabelle: Zeigt frühere Trenddauern für bullische und bärische Zyklen sowie deren Durchschnitte an.
Adaptive Stichprobennahme: Verwendet eine anpassbare Stichprobengröße, um die Volatilität in der Prognose zu glätten und statistisch aussagekräftige Projektionen zu liefern.
Farbkodierte Klarheit: Hebt Aufwärtstrends in Grün und Abwärtstrends in Rot hervor für eine sofortige visuelle Interpretation.
Vergleichen Sie die Real Length des laufenden Trends mit der Probable Length Prognose, um abzuschätzen, ob sich die Bewegung der Erschöpfung nähert.
Ideal für Swing- oder Trendfolge-Strategien, bei denen die Trenddauer entscheidend für das effektive Management von Ein- und Ausstiegen ist.
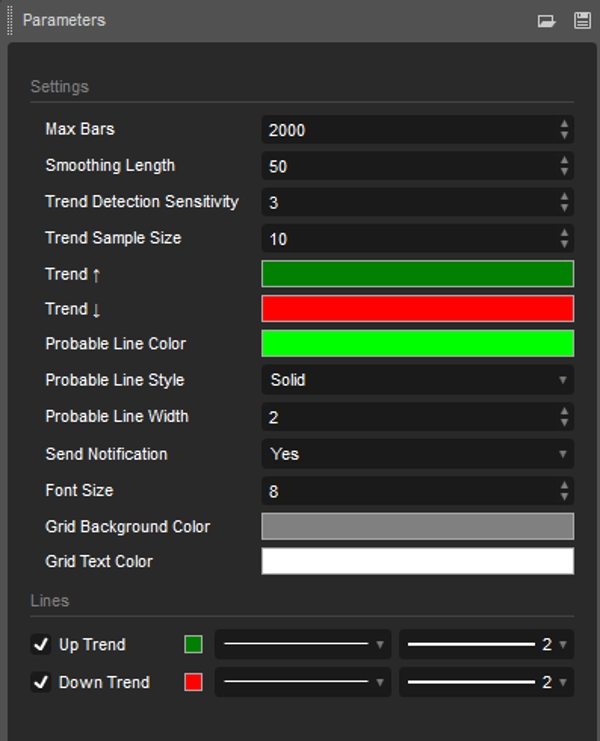
EINSTELLUNGEN
Trend-Erkennungsempfindlichkeit: Steuert, wie schnell oder langsam der Indikator auf Trendwechsel reagiert — niedrigere Werte erhöhen die Reaktionsfähigkeit, während höhere Werte das Rauschen glätten.
Trend-Stichprobengröße: Historische Dauertabelle, um die durchschnittliche Lebensdauer von Trends in der aktuellen Marktstruktur zu verstehen
Farbtrend: Verwenden Sie die farbige HMA-Linie und Projektionpfeile, um zu erkennen, wann die Momentumstärke nachlässt und bereiten Sie sich auf mögliche Umkehrungen vor.
Alarm: Alarm bei Trendwende.
Der Trend Duration Forecast verschafft Händlern einen quantitativen Vorteil, indem er Echtzeit-Trendverfolgung mit statistischer Prognose kombiniert. Er hilft nicht nur dabei zu erkennen, wann ein neuer Trend beginnt, sondern auch, wie lange er voraussichtlich basierend auf vergangenem Marktverhalten anhalten wird. Dieser Indikator verbessert die Timing-Genauigkeit für Ein- und Ausstiege und unterstützt intelligentere Trendfolge-Entscheidungen mit klaren, datenbasierten Erkenntnissen.


