Descripción
Lo que analiza
Esto no se basa en mechas o cierres. Para cada barra, construye un perfil de volumen real usando una ventana móvil de 5 barras, divide el rango de precios en 200 segmentos y encuentra dónde se negoció realmente el mayor volumen — ese es el nivel desde el que trabaja. Luego escanea esa serie en busca de máximos y mínimos oscilantes usando dos velocidades de retroceso: una rápida para pivotes recientes y otra más lenta y amplia para los más establecidos.
Cómo leerlo
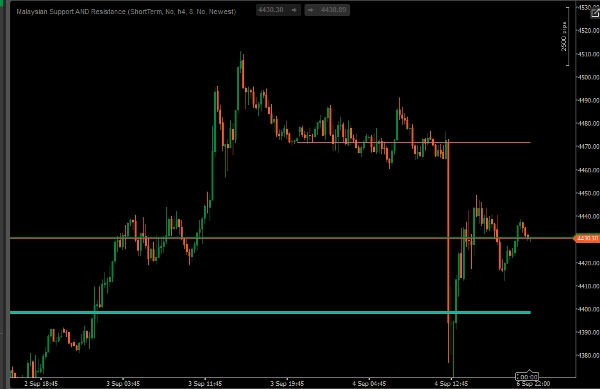
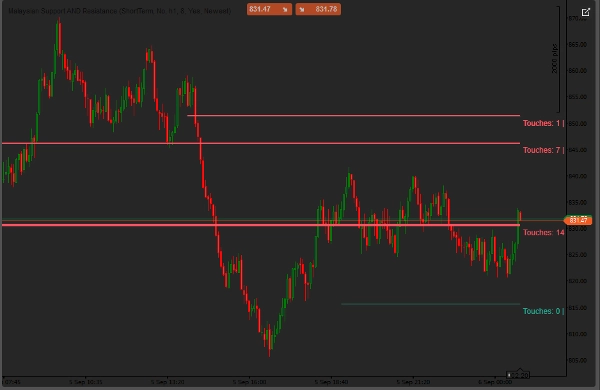
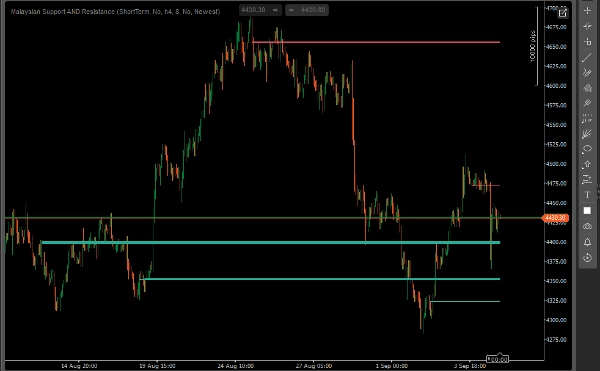
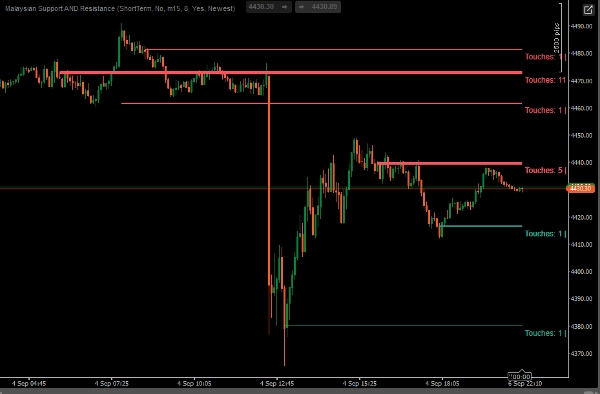
Cada línea es un nivel de soporte o resistencia. El color muestra si el precio actual está por encima (soporte) o por debajo (resistencia). El grosor indica su importancia — cuántas veces el precio lo ha tocado y cuánto volumen se negoció cerca. Activa "Mostrar Toques | Conteo de Volumen" y pasa el cursor sobre una línea para ver los números exactos. Verás hasta 8 niveles a la vez: el máximo/mínimo más reciente y rápido, más 3 máximos establecidos y 3 mínimos establecidos.
Configuraciones clave
- Vista del Mercado — Corto Plazo / Estándar / Largo Plazo, controla cuán atrás busca pivotes
- Usar el Marco Temporal del Gráfico o un Marco Temporal Superior específico
- Número de Líneas a Mostrar — de 1 a 8
- Seleccionar Niveles Por — Más Nuevos (los 3 más recientes) o Más Fuertes (los 3 más tocados/con mayor volumen, sin importar la antigüedad)
- Mostrar Toques | Conteo de Volumen — añade los números a cada línea
- Colores de Soporte/Resistencia — totalmente personalizables
Para quién es
Traders que trabajan con acción del precio, SMC o conceptos estilo ICT que quieren soporte/resistencia objetivo en lugar de dibujarlo a mano. Funciona mejor como una capa de confluencia junto con tu propia estructura y lecturas de liquidez, no como una señal independiente.
Vale la pena saber
- Los niveles solo se confirman una vez que han pasado suficientes barras para probarlos — el precio reciente no moverá un nivel ya confirmado
- El volumen es volumen de ticks, estándar para forex/CFDs/sintéticos — no volumen negociado en bolsa
- Dale algo de historia para trabajar. En un instrumento recién listado o tranquilo, puede que veas menos de 8 niveles al principio, llenándose a medida que se confirman más pivotes
Resumen
Displayed lines represent support or resistance, with color indicating whether the current price is above (support) or below (resistance) the level. Line thickness reflects importance based on the frequency of price touches and volume traded near the level. Users can view up to eight levels simultaneously, including the newest fast-forming pivots and multiple established highs and lows. Additional features include customizable settings for market view (short to long term), timeframe selection, number of lines shown, level selection criteria (newest or strongest), and display of touch and volume counts.
This indicator is designed for traders employing price action, Smart Money Concepts (SMC), or ICT-style methods who prefer objective support and resistance levels derived from volume data rather than manual drawing. It functions best as a complementary tool alongside other structural and liquidity analyses. The volume data used is tick volume, standard for forex, CFDs, and synthetic instruments.