Description
This indicator analyses the first 4-hour candle of each trading day to establish a daily price range. It identifies the high, low, and the close of the preceding 4H candle — three key levels that institutional traders and algorithms reference heavily at the start of each session. It also analyses 15-minute swing structure to determine the current market bias. this indicator can be used on any market prefer indices.
How to interpret signals and visual elements
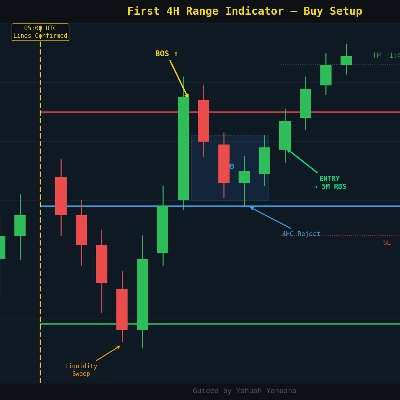
- Red horizontal line — the high of the first 4H candle. Acts as the upper boundary of the daily range and a potential resistance level
- Green horizontal line — the low of the first 4H candle. Acts as the lower boundary and potential support
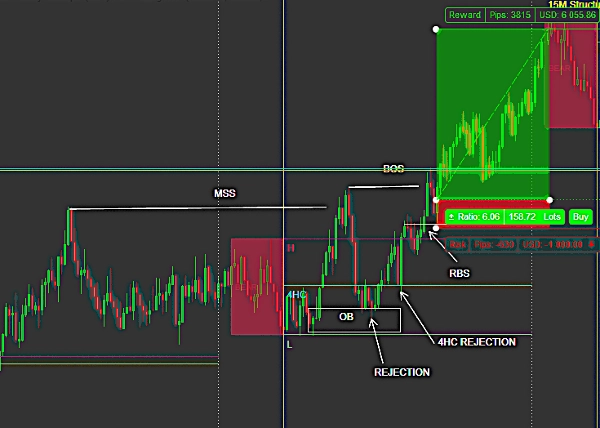
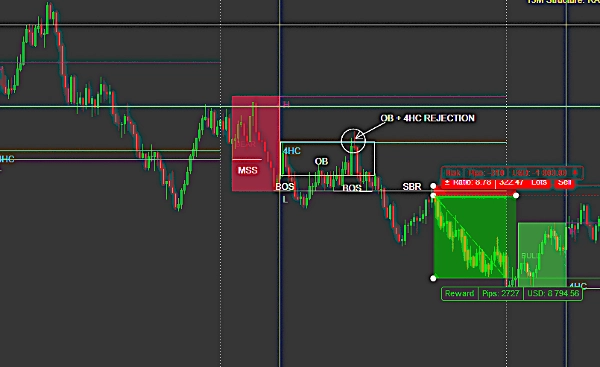
- Blue horizontal line (4HC) — the close of the previous 4H candle, marking where price stood at the start of the new day. Often acts as a mid-range liquidity level
- Gold vertical line — marks the exact bar where all levels were confirmed, making it easy to see when the range was set
- 15M Structure panel — displays Bullish, Bearish, or Ranging bias based on recent swing highs and lows, with HH/HL/LH/LL labels plotted on the chart
All lines appear solid and locked the moment the first 4H candle closes. Nothing repaints or moves after confirmation.
Key settings and parameters
- Max History Days — controls how many past days of levels are displayed
- Show 4H Close at Day Open — toggles the blue 4HC line on/off
- Show Day-Start Gold Line — toggles the gold vertical line
- Show Vertical Markers — bounded tick marks at the range boundaries for visual reference
- 15M Structure Bias — toggle swing labels and bias panel (5M chart only)
- Swing Lookback / Swing Count — controls sensitivity of structure detection
- Full color, thickness, and line style customisation for every element
Typical use cases and trading scenarios
- Using the H and L as a daily range to look for reversals or breakouts during killzones (London/NY open)
- Using the 4HC level as a mid-range target or confluence entry level
- Combining the range with SMC, ICT, or CRT frameworks for high-probability setups
- Checking the 15M bias panel before taking a 5M entry to ensure structural alignment
Who this indicator is best suited for
Intermediate to advanced intraday traders who use the daily opening range as a structural reference. Particularly suited to traders using Smart Money Concepts (SMC), ICT, or similar methodologies. Works across all timeframes but pairs best with 5M or 1M for entry precision.
Important limitations and usage notes
- Levels only appear after the first 4H candle of the day closes — no levels are shown while that candle is still forming
- The exact time levels appear depends on your broker's 4H candle alignment. On Deriv, the first 4H candle opens at 01:00 UTC and closes at 05:00 UTC
- The 15M structure bias panel is restricted to the 5M chart only
- For best scroll performance, disable the gold vertical line or reduce Max History Days if experiencing lag