
Descrição
Se você está procurando um indicador dinâmico de canal Fibonacci para cTrader, não procure mais. Este indicador desenha automaticamente bandas de Fibonacci paralelas a uma média móvel de sua escolha. É fácil de usar e, como meus outros indicadores, fornece alertas por meio de Pop-up, Som, Email e mensagens no Telegram. Além disso, você tem a flexibilidade de personalizar as Bandas, níveis de Fibonacci e Alertas.
Aqui está uma lista de seus recursos:
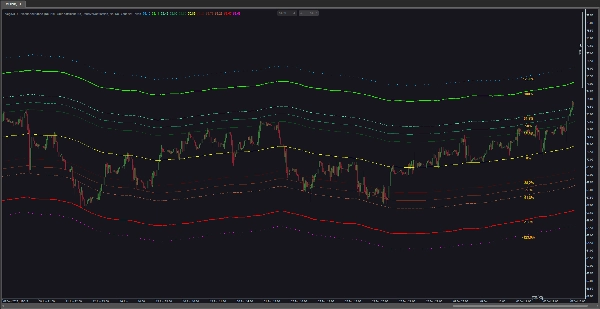
- Cálculo das Bandas de Fibonacci: O indicador calcula e plota bandas de Fibonacci com base na média móvel selecionada. Essas bandas derivam dos níveis de Fibonacci (por exemplo, 0,0%, 38,2%, 61,8% ou outros) e se estendem acima e abaixo da média móvel por um fator especificado.
- Configuração da Média Móvel: Personalize o tipo de média móvel (por exemplo, Simples, Exponencial, etc.) e o número de períodos usados no cálculo. A média móvel serve como base para as bandas de Fibonacci.
- Funcionalidade de Alerta: O indicador oferece várias opções de alerta para notificar os traders sobre eventos específicos. Isso inclui alertas de toque em níveis de preço e alertas de proximidade.
- Alertas de Toque em Nível de Preço: Configure o indicador para disparar alertas quando o preço tocar níveis específicos de Fibonacci. Os alertas podem ser baseados no preço de fechamento ou imediatamente quando o preço tocar o nível.
- Alertas de Proximidade: Configure alertas de proximidade para receber notificações quando o preço se aproximar ou se afastar de um nível de Fibonacci especificado dentro de uma distância definida. Os alertas podem ser acionados quando o preço estiver se aproximando ou se afastando do nível.
- Opções de Saída de Alerta: Escolha entre alertas sonoros, pop-ups, mensagens no Telegram e notificações por email para os alertas. Os alertas sonoros podem ser personalizados selecionando diferentes arquivos de som.
- Opções de Visualização: Personalize a visualização dos níveis de Fibonacci com opções como exibir valores percentuais, definir cor para os rótulos percentuais, controlar a localização dos rótulos no gráfico, ativar/desativar bandas específicas e escolher cor, espessura e aparência das bandas.
- Níveis de Fibonacci Configuráveis: Ajuste o indicador à sua estratégia de negociação modificando os níveis específicos de Fibonacci usados no cálculo. Níveis positivos e negativos de Fibonacci podem ser personalizados individualmente.
- Guia do Usuário Integrado: Você pode acessar o guia do usuário deste indicador diretamente do gráfico.
Em resumo, o indicador VegaXLR - Bandas de Fibonacci combina análise de Fibonacci e médias móveis para ajudar a identificar potenciais níveis de suporte e resistência. Com funcionalidade de alerta configurável e opções de visualização, é uma ferramenta inestimável para traders que dependem de retrações ou expansões de Fibonacci.
Resumo
It features multiple alert options including price level touch alerts—triggered on price contact or close at specified Fibonacci levels—and proximity alerts that notify when price approaches or moves away from these levels within a defined range. Alerts can be delivered via pop-up, sound (with customizable sounds), email, and Telegram messages.
Visualization settings enable customization of band colors, thickness, label display and position, and selective enabling or disabling of bands. A built-in user guide is accessible directly from the chart for ease of use.
Overall, VegaXLR - Fibonacci Bands combines Fibonacci retracement and expansion analysis with moving averages to assist traders in identifying potential support and resistance zones, enhanced by configurable alerts and visualization options.
Avaliações de clientes
5 | 100 % | |
4 | 0 % | |
3 | 0 % | |
2 | 0 % | |
1 | 0 % |


![Logótipo de "[Stellar Strategies] Inside Bar with Signals"](https://cdn.ctrader.com/image/webp/1d9e8bfa-3b2c-4440-bb37-5856902008a7_30683)


