
VegaXLR - cTrader Chart Themes
Indicador
336 transferências
Versão 1.1, Nov 2025
Windows, Mac
5.0
Avaliações: 3
Descrição
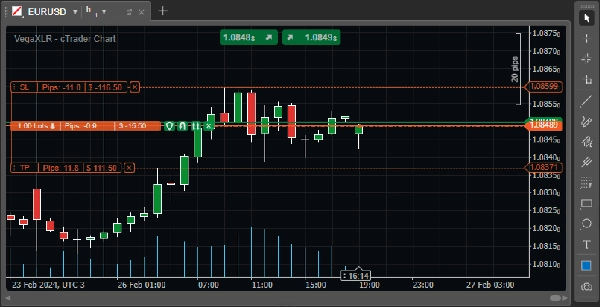
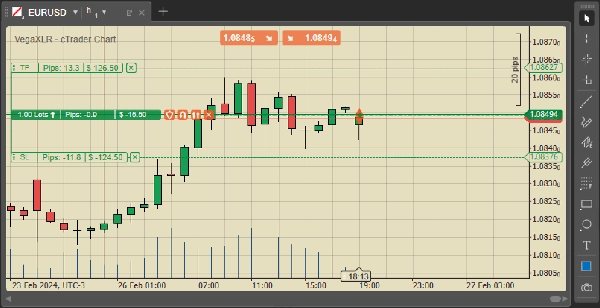
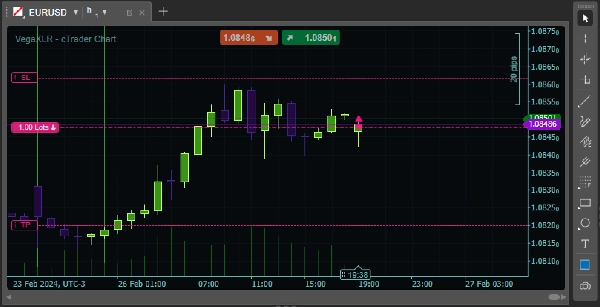
Este é um pacote gratuito de temas de gráfico cTrader. Estes temas não irão alterar as configurações dos seus modelos de gráfico, eles apenas mudarão as cores do gráfico.
Como Aplicar:
- Instale o arquivo como qualquer outro indicador — basta dar um duplo clique nele.
- Adicione o indicador ao seu gráfico.
- Selecione o tema de sua preferência.
- Quando estiver satisfeito com o tema, remova o indicador do gráfico.
- Salve o tema como um modelo de gráfico. Pronto!
Procurando mais ferramentas para cTrader? Confira a seção "Mais deste autor" abaixo. Você encontrará uma variedade de indicadores e cBots, incluindo alertas de média móvel, perfil de volume de faixa fixa, alertas de linha de tendência e muito mais!
Resumo
Resumo de IA
VegaXLR - cTrader Chart Themes is a free pack of customizable chart color themes designed for the cTrader trading platform. The product allows users to change the visual color scheme of their charts without altering any existing chart template configurations. Installation involves adding the indicator to a chart, selecting a preferred theme, then removing the indicator and saving the theme as a chart template. This tool supports various market types including Forex, Indices, Commodities, Crypto, and Stocks, providing a straightforward way to personalize chart appearance across these markets on cTrader.
Perfil do indicador
Avaliações de clientes
5.0
Avaliações: 3
5 | 100 % | |
4 | 0 % | |
3 | 0 % | |
2 | 0 % | |
1 | 0 % |
Avaliações de clientes
March 31, 2026
September 18, 2025
Conversa
Perguntas frequentes
Prop
Forex
Indices
Commodities
Crypto
Stocks
Os produtos disponíveis através da cTrader Store, incluindo bots de negociação, indicadores e plugins, são fornecidos por programadores terceiros e são disponibilizados apenas para fins informativos e de acesso técnico. A cTrader Store não é um corretor e não fornece aconselhamento em matéria de investimento, recomendações pessoais ou qualquer garantia de desempenho no futuro.


Também poderá gostar de


Preço
231
Vendas
692
Instalações gratuitas