
Descrição
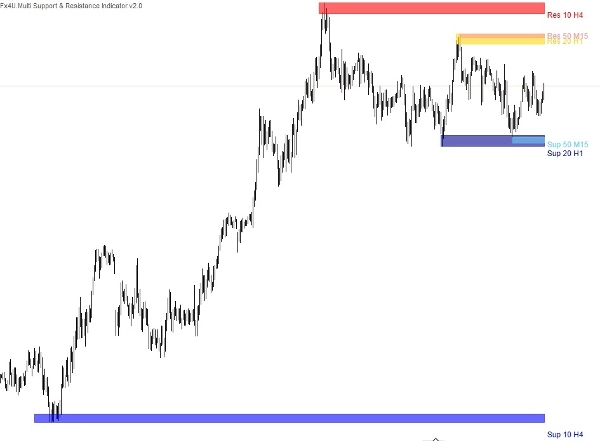
Indicadores de suporte e resistência em múltiplos períodos geralmente permitem que os traders visualizem esses níveis em diferentes intervalos de tempo, como gráficos horários, diários, semanais ou mensais. Ao incorporar múltiplos períodos, os traders podem obter uma perspectiva mais ampla sobre onde os níveis-chave de preço estão localizados e como eles podem influenciar a ação do preço.
Esse tipo de indicador pode ajudar os traders a tomar decisões de negociação mais informadas, identificando níveis significativos de suporte e resistência que podem impactar os movimentos de preço em vários períodos. Também pode ajudar os traders a antecipar potenciais reversões ou oportunidades de rompimento quando o preço se aproxima desses níveis em múltiplos períodos.
Existem três tipos de níveis de suporte e resistência:
Os três indicadores de suporte e resistência estão incorporados neste único indicador, permitindo que você plote suas zonas de oferta e demanda no gráfico com as seguintes configurações.
- Valor do período.
- Intervalo de tempo.
- Número de extremos – Este é o número de pontos atuais + passados de Suporte/Resistência exibidos. Por exemplo, se escolhermos 2, o indicador selecionará outro ponto de Suporte e Resistência no passado.
- Nome e cor do indicador.
Níveis de suporte e resistência que são significativos em períodos maiores tendem a ter mais peso e, ao usar um indicador de múltiplos períodos, os traders podem confirmar a importância de um nível se ele aparecer consistentemente em vários períodos. Essa confirmação aumenta a confiabilidade do nível e reforça a confiança dos traders em suas decisões de negociação.
Meus outros produtos:
https://ctrader.com/products/346
https://ctrader.com/products/336
https://ctrader.com/products/343
https://ctrader.com/products/347
https://ctrader.com/products/147
Resumo
The indicator consolidates three types of support and resistance levels into a single tool, allowing users to plot supply and demand zones with customizable settings such as period value, timeframe, the number of extremum points (current plus past support/resistance points), and indicator name and color. This multi-timeframe approach helps traders identify levels that carry more weight when confirmed across different timeframes, enhancing the reliability of these levels for decision-making.
By visualizing these critical zones, the indicator aids in anticipating potential price reversals or breakout opportunities. It supports a broader market overview, enabling more informed trading strategies based on the interaction of price with established support and resistance across various time horizons.
Avaliações de clientes
5 | 33 % | |
4 | 67 % | |
3 | 0 % | |
2 | 0 % | |
1 | 0 % |
![Logótipo de "[Fx4U] GBPUSD - Price Action"](https://cdn.ctrader.com/image/webp/d80b34fc-da3c-4f01-a321-456450665649_26190)

![Logótipo de "[Fx4U] CADJPY - Price Action"](https://cdn.ctrader.com/image/webp/1ba81247-b6b7-4f3c-a297-fa3eb1d57fe1_26195)

![Logótipo de "[Fx4U] AUDCHF - Price Action"](https://cdn.ctrader.com/image/webp/0a22e9aa-c83b-42cd-b0b8-c1a2da593207_26148)

![Logótipo de "[Fx4U] EURAUD - Price Action"](https://cdn.ctrader.com/image/webp/baf8dde4-1ef3-4beb-8ae2-0fed8320f65d_26177)


![Logótipo de "[Hamster-Coder] Pivot Points MTF"](https://cdn.ctrader.com/image/webp/4c143e5a-309c-40e3-a578-f04d1e133ffa_31159)


