
Descrição
🧭 Cronometre suas negociações pelo relógio: Atlas revela quando os mercados tendem a se mover por mês, dia da semana e hora. 🧭
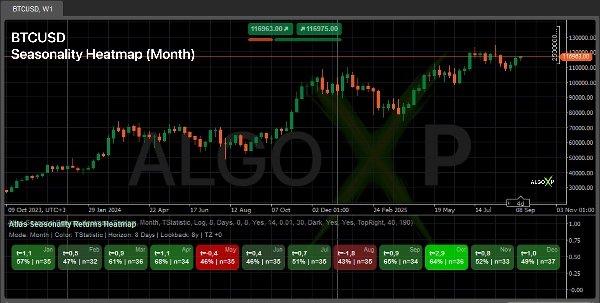
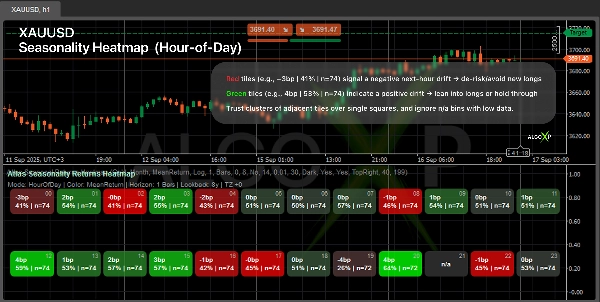
Veja quando seu mercado tende a se mover — por Mês, Dia da Semana ou Hora do Dia.
Atlas calcula retornos futuros em um horizonte que você escolher e pinta um mapa de calor simétrico (Baixo → Zero → Alto). Cada bloco mostra uma métrica (Média, T-stat, ou Sharpe) mais hit% | n. Use para cronometar entradas/saídas, planejar sessões e filtrar riscos.
🎯 Por que os traders o usam
- Identifique janelas verdes para se posicionar e janelas vermelhas para se afastar.
- Planeje sessões em torno de horas/dias estatisticamente favoráveis.
- Adicione uma camada limpa de “quando” para estratégias discricionárias e sistemáticas.
⚙️ Como funciona
- Olha para frente em uma janela que você escolher e resume como o preço tende a se comportar nessa janela.
- Agrupa os resultados em intervalos de tempo (Mês / Dia da Semana / Hora) e respeita seu fuso horário.
- Aplica proteção contra outliers e uma pontuação robusta de força por intervalo (mais tamanho da amostra).
- Pinta um mapa de calor equilibrado em torno do neutro usando suas cores Alto / Zero / Baixo.
👥 Para quem é
- Traders discricionários — melhor temporização e dimensionamento por sessão.
- Construtores de sistemas e bots — uma camada de filtro de tempo / dimensionamento temporal para estratégias.
- Traders de cripto e índices — padrões comportamentais rápidos entre dias/horas.
- Iniciantes — leitura simples: mais verde = viés mais positivo no horizonte escolhido.
🚀 Início rápido
- Escolha Predefinição de Ativo (Forex/Cripto/Índice/Ouro).
- Defina o Horizonte (ex., 1 Hora para HOD, 1 Dia para DOW/Mês).
- Ajuste o Período de Observação, Mínimo de Observações e as cores.
- Leia os agrupamentos (vários blocos verdes/vermelhos adjacentes) para os sinais mais fortes.
ℹ️ A sazonalidade não garante resultados futuros. É um padrão estatístico que depende do período e da metodologia. Use o indicador como contexto para suas regras de entrada/saída e gestão de risco, teste a robustez em múltiplas janelas de observação e evite confiar em intervalos com baixo n (tamanho da amostra).
Resumo
The indicator supports multiple asset presets including Forex, Crypto, Indices, and Commodities, and respects the user’s timezone. It applies outlier protection and calculates a robust strength score per time bucket to ensure reliable insights. Users can customize parameters like lookback period, minimum observations, and color schemes.
Atlas is suitable for discretionary traders seeking better timing and sizing, system and bot builders needing a time-based filter or sizing layer, crypto and index traders analyzing behavioral patterns, and beginners looking for a straightforward indication of positive or negative market bias. It provides a statistical context for entry/exit decisions and risk management but should be used alongside other analysis tools.
Avaliações de clientes
5 | 50 % | |
4 | 50 % | |
3 | 0 % | |
2 | 0 % | |
1 | 0 % |


![Logótipo de "[CB] Pivot Points Pro"](https://cdn.ctrader.com/image/webp/43463c82-67b0-4f10-a4ba-901bba091d81_32594)


