

Descrição
PERFIL DE VOLUME DE INTERVALO FIXO (FRVP)
Indicador de Perfil de Volume com Detecção Automática
--------------------------------------------------
Distribuição de volume. Áreas de valor. Nós de alto volume. Tudo a partir da sua linha de tendência.
--------------------------------------------------
O QUE ESTE INDICADOR FAZ
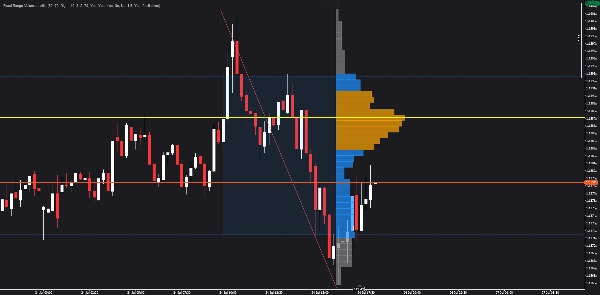
O Perfil de Volume de Intervalo Fixo (FRVP) exibe a distribuição de volume em um intervalo definido pelo usuário — detectando automaticamente a última linha de tendência que você desenha no gráfico.
Não é necessário selecionar o intervalo manualmente. Basta desenhar uma linha de tendência e o perfil aparece.
--------------------------------------------------
PRINCIPAIS CARACTERÍSTICAS
- DETECÇÃO AUTOMÁTICA da última linha de tendência (não é necessário nomear manualmente)
- Ponto de Controle (POC) - nível de volume mais alto
- Área de Valor (VAH + VAL) - porcentagem configurável (padrão 70%)
- Nós de Alto Volume (HVN) - volume acima do limite médio
- Exibição em histograma (lado esquerdo ou direito do intervalo)
- Linhas configuráveis (10 a 200)
- Cores e opacidade personalizáveis
- Estender linhas para a direita
- Mostrar/ocultar etiquetas de preço
- Sem repintura
--------------------------------------------------
COMO FUNCIONA
1. Desenhe uma linha de tendência no gráfico
2. O indicador a detecta automaticamente
3. O perfil de volume é calculado a partir do intervalo
4. POC, VAH, VAL e HVN são exibidos
Não é necessário nomear. Nenhuma seleção manual de intervalo.
--------------------------------------------------
ELEMENTOS VISUAIS
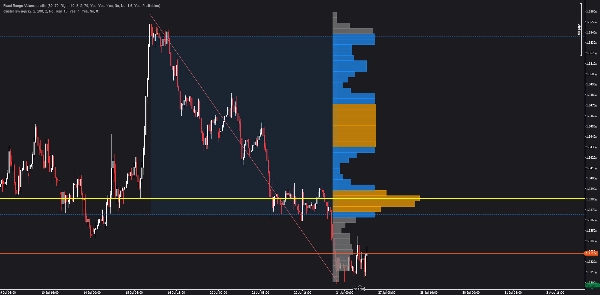
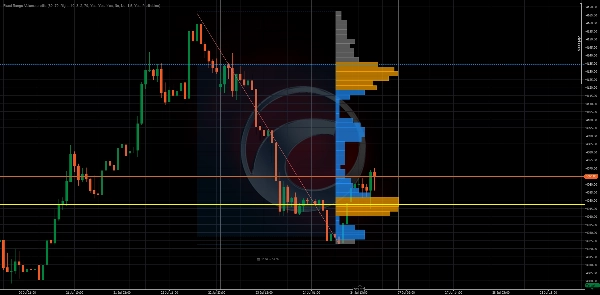
- Linha horizontal amarela = Ponto de Controle (POC)
- Linhas azuis tracejadas = Valor Alto da Área (VAH) e Valor Baixo da Área (VAL)
- Barras laranjas = Nós de Alto Volume (HVN)
- Barras cinzas = Nós de baixo volume
- Região sombreada = Área de Valor (70% do volume)
- Histograma = Distribuição de volume por nível de preço
--------------------------------------------------
VISÃO GERAL DOS PARÂMETROS
CONFIGURAÇÕES DO PERFIL:
- Número de Linhas: Quantas linhas de preço (10-200)
- Percentual da Área de Valor: % do volume na área de valor (1-100)
CONFIGURAÇÕES VISUAIS:
- Lado do Perfil: Esquerdo ou Direito do intervalo
- Largura do Histograma %: Largura das barras do histograma
- Escala da Largura da Barra: Fator de escala para larguras das barras
- Largura Mínima da Barra %: Largura mínima da barra
- Opacidade da Barra: Transparência das barras (10-100)
CORES:
- Cor do POC
- Cor da Área de Valor
- Cor do Nó de Alto Volume
- Cor de Baixo Volume
NÓS DE ALTO VOLUME:
- Limite HVN: Multiplicador de volume para qualificar como HVN
CONFIGURAÇÕES DA LINHA DE TENDÊNCIA:
- Detecção Automática da Última: Encontra automaticamente a última linha de tendência
- Nome Manual da Linha de Tendência: Especifique um nome (se a detecção automática estiver desligada)
--------------------------------------------------
CASOS DE USO
- Identificar onde ocorreu a maior parte do volume
- Encontrar o Ponto de Controle (POC) para entradas/saídas
- Usar a Área de Valor (VAH/VAL) para metas de lucro
- Identificar Nós de Alto Volume (HVN) para níveis-chave
- Entender a distribuição de volume rapidamente
- Combinar com outros indicadores para confluência
--------------------------------------------------
ATUALIZE PARA STRUCTURAL HEAT ZONES
Este indicador mostra a distribuição de volume.
Structural Heat Zones vai além — mapeia a intensidade de participação, aceitação vs rejeição e engajamento do mercado em várias zonas.
Procure por Structural Heat Zones na cTrader Store.
--------------------------------------------------
ATUALIZE PARA INVICTUS EA
Invictus EA usa tecnologia estrutural para executar negociações automatizadas.
Procure por Invictus na cTrader Store.
--------------------------------------------------
NOTAS TÉCNICAS
- Indicador sobreposto
- Funciona em qualquer período e símbolo
- Sem repintura (cálculo histórico)
- Otimizado para desempenho
--------------------------------------------------
SUPORTE
Atualizações vitalícias incluídas.
PARA MAIS INFORMAÇÕES - Clique no Perfil do Desenvolvedor abaixo.





























