
Descrição
O que é a Curva Coppock?
A Curva Coppock é um indicador de momentum de longo prazo originalmente projetado para identificar fundos importantes do mercado no S&P 500. Foi criada em 1962 pelo economista Edwin Coppock, que foi famoso por ser solicitado pela Igreja Episcopal para encontrar oportunidades de compra de baixo risco para seu fundo patrimonial.
Em termos simples, é um oscilador seguidor de tendência que indica quando um mercado em baixa provavelmente atingiu o fundo e um novo mercado em alta está começando.
O “Molho Secreto” (Como Funciona)
Ao contrário de muitos indicadores que são nervosos e reativos, a Curva Coppock é deliberadamente lenta. Ela é calculada tomando uma Média Móvel Ponderada (WMA) da soma de duas Taxas de Variação (ROC) diferentes.
Coppock = WMA(10) de (ROC(14) + ROC(11))
A Lógica:
Ela mede a taxa na qual o momentum do preço está mudando ao longo de longos períodos (geralmente 11 e 14 meses). Ao suavizar esses dados com uma média ponderada, filtra quase todo o ruído de mercado de curto prazo.
Curiosidade:
Diz-se que Coppock perguntou a bispos quanto tempo leva para uma pessoa se recuperar da dor de perder um ente querido. Eles disseram “11 a 14 meses.” Ele aplicou esses mesmos períodos ao mercado, raciocinando que a psicologia do mercado segue um ciclo semelhante de luto e recuperação.
Por que é Útil?
Traders e investidores adoram a Curva Coppock por três motivos principais:
- Ela Filtra o Ruído: Como é calculada em períodos mensais (tradicionalmente), ignora a volatilidade diária ou até semanal. Não dispara com frequência, mas quando o faz, geralmente é significativo.
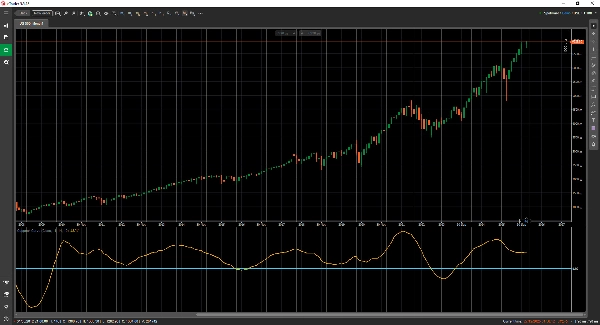
- Sinais Claros de Compra: O sinal é binário e fácil de ler. Um sinal de “Compra” é gerado quando a curva está abaixo da linha zero e se volta para cima (começa a subir).
- Âncora Psicológica: Evita que você tente “pegar uma faca caindo.” Obriga você a esperar até que o momentum tenha mudado matematicamente de negativo para positivo antes de entrar em uma posição.
Quando Usá-la
- Melhor para: Investimento de longo prazo, alocações para aposentadoria e identificação do início de uma nova alta.
- Não para: Day trading ou venda a descoberto. Não foi projetada para identificar sinais de venda ou topos de mercado.


