الوصف
زخم تعلم الآلة KNN توقف عن التأخر. ابدأ بالتنبؤ. تحليلات K-Nearest Neighbors بمستوى مؤسسي.
المعلمات الافتراضية محسّنة لـ XAUUSD. تعمل على أي إطار زمني — اختر بناءً على أسلوب تداولك. الأطر الزمنية الأعلى تقدم إشارات أنظف وباحتمالية أعلى. الأطر الزمنية الأدنى تولد المزيد من الإشارات مع ضوضاء أكثر قليلاً. راجع دليل الإطار الزمني أدناه.
🥈 متوفر أيضًا: نسخة بوت آلي لـ XAGUSD هل تحب المنطق؟ خذه إلى أبعد من ذلك. نسخة بوت مخصصة لهذا المؤشر — مضبوطة خصيصًا لـ XAGUSD (الفضة) — متوفرة في السوق. يعمل بشكل آلي بالكامل، ينفذ الصفقات نيابة عنك دون الحاجة لأي إدخال يدوي. سعره منخفض مقارنة بالعائد المتوقع.
👉 بوت KNN لـ XAGUSD — عرض في سوق cTrader
⏱ دليل الإطار الزمني
الإطار الزمنيحجم الإشارةملاحظات
M5
مرتفع جدًا
المزيد من الضوضاء — يتطلب انضباطًا وتصفية أكثر صرامة لتجنب الإفراط في التداول.
M8
مرتفع (افتراضي)
الخط الأساسي المحسن. أفضل توازن بين تكرار الإشارة والدقة لـ XAUUSD.
M15
متوسط
إشارات أنظف وأعلى جودة مع عدد أقل من الإدخالات لكل جلسة.
M30 / H1
منخفض
أعلى دقة — الأنسب لإعدادات نمط التأرجح مع الحاجة إلى مزيد من الصبر.
تم اختبار المعلمات الافتراضية على M8. إذا قمت بتغيير الإطارات الزمنية، فكر في تعديل فترة ATR وضربات SL/TP وفقًا لذلك.
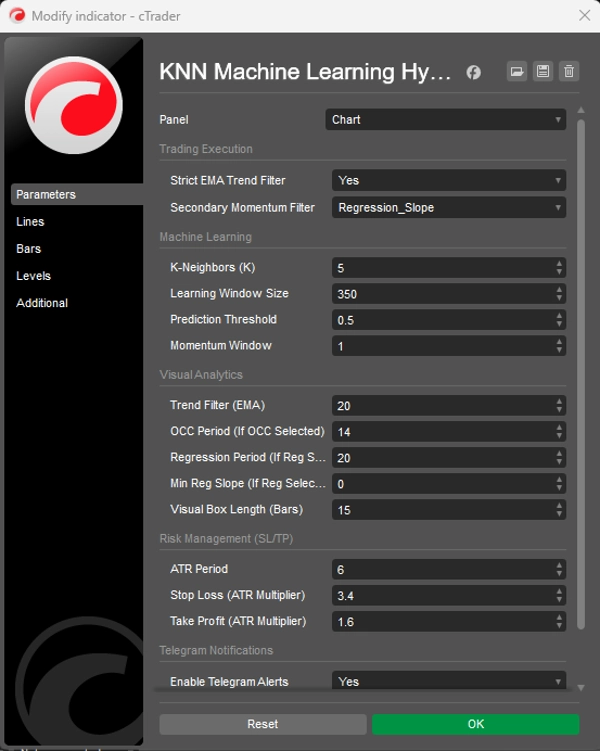
⚙️ المعلمات الافتراضية
نافذة التعلم (350) — عدد الشموع التاريخية التي يفحصها محرك KNN للعثور على تطابقات النمط.
عتبة التنبؤ (0.5) — الحد الأدنى لدرجة الثقة المطلوبة قبل توليد إشارة.
فترة ATR (6) — الفترة المستخدمة لحساب متوسط النطاق الحقيقي لتحديد حجم SL/TP.
مضاعف وقف الخسارة (3.4) — مسافة وقف الخسارة = ATR × 3.4. أوسع لإعطاء تقلب الذهب مجالًا للتنفس.
مضاعف جني الأرباح (1.6) — مسافة جني الأرباح = ATR × 1.6. أضيق لقفل الأرباح بسرعة والحفاظ على معدل فوز مرتفع.
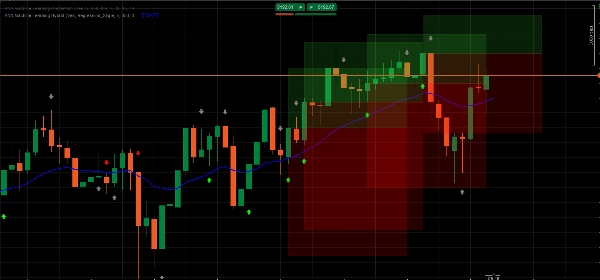
مرشح الاتجاه EMA (20) — فترة EMA المستخدمة كمرشح للاتجاه — الخط الأزرق على الرسم البياني الخاص بك.
🤖 محرك KNN التنبؤي يضغط انحراف RSI و MA إلى خوارزمية تطابق تاريخية. في كل شمعة، يفحص آخر 350 شريطًا ويجد 5 لحظات ماضية الأكثر تشابهًا للتنبؤ بالاتجاه.
📈 مرشح اتجاه EMA صارم يقمع إعدادات الاتجاه المعاكس منخفضة الاحتمالية تلقائيًا. فقط الإشارات المتوافقة مع الاتجاه الأوسع تُعتبر عالية الاحتمالية.
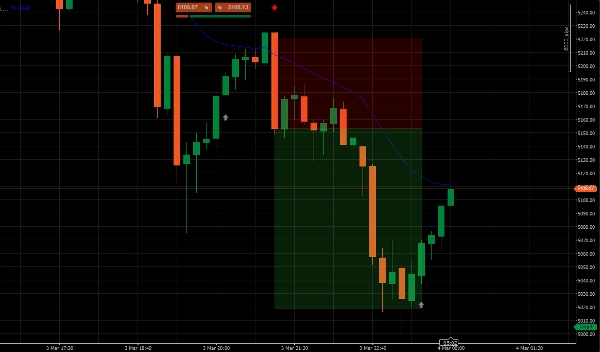
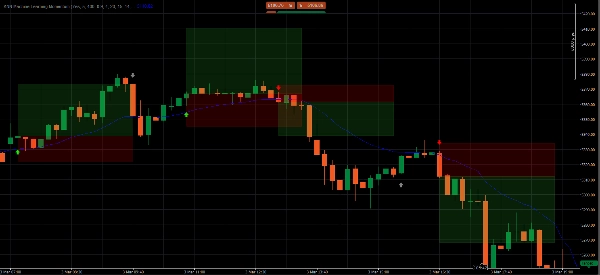
📦 مناطق هدف ATR ديناميكية يعرض مربعات ملونة شفافة لمناطق جني الأرباح ووقف الخسارة، تتكيف في الوقت الحقيقي مع تقلب السوق الحالي عبر ATR.
🧹 مدير ذاكرة واجهة المستخدم يحافظ على نظافة الرسم البياني الخاص بك عن طريق إزالة المناطق القديمة تلقائيًا. يتم عرض أحدث 5 إعدادات فقط في أي وقت.
📲 تنبيهات دفع عبر Telegram تكامل webhook مدمج يرسل تنبيهات تداول فورية مع أسعار الدخول، TP، و SL الدقيقة مباشرة إلى هاتفك.
📊 قراءة الإشارات
🟢 سهم أخضر فاتح — شراء عالي الاحتمالية يتنبأ KNN بأن السعر سيرتفع و السعر فوق EMA. توافق كامل مع الاتجاه. هذه هي الإعدادات المميزة للتداول.
🔴 سهم أحمر فاتح — بيع عالي الاحتمالية يتنبأ KNN بأن السعر سينخفض و السعر تحت EMA. توافق كامل مع الاتجاه. ادخل عند إغلاق شمعة الإشارة.
⚪ سهم رمادي — عكس الاتجاه (لا تتداول) تم الكشف عن تحول في الزخم، لكنه ضد الاتجاه الأوسع. مطبوع للوعي فقط — احتمالية أقل بكثير.
▶️ دليل التنفيذ
- انتظر ظهور سهم أخضر فاتح أو أحمر فاتح — تجاهل الإشارات الرمادية تمامًا.
- انتظر إغلاق شمعة الإشارة بالكامل قبل الدخول.
- حدد وقف الخسارة وجني الأرباح عند الحافة الأفقية الخارجية لكل مربع — الحافة الأبعد عن سعر دخولك.
❓ الأسئلة الشائعة
لماذا يظهر السهم؟ في كل شمعة، يلتقط الخوارزمية حالة RSI و MA الحالية، ويفحص آخر 350 شريطًا لأكثر 5 لحظات تشابهًا رياضيًا، ويتنبأ بالاتجاه بناءً على وجهة السعر من تلك اللحظات.
ما الذي يجعل السهم فاتحًا مقابل رمادي؟ الأسهم الفاتحة = إشارة الذكاء الاصطناعي واتجاه EMA في اتفاق كامل — أعلى احتمالية. الأسهم الرمادية = تم الكشف عن الزخم لكنه عكس الاتجاه — تم تمييزه كمخاطرة عالية جدًا للتداول.
أي إطار زمني يجب أن أستخدم؟ M8 هو الافتراضي المحسن. الأطر الزمنية الأعلى (M15، M30، H1) تعطي إشارات أقل لكنها أنظف. M5 يعطي المزيد من الإشارات لكنه يتطلب انضباط تصفية أشد.
أين بالضبط أضع وقف الخسارة وجني الأرباح؟ عند الحافة الأفقية الخارجية لكل مربع ملون — الحافة الأبعد عن سعر دخولك.
هل يمكنني استخدام هذا على أصول غير الذهب؟ نعم — ينطبق على أي أصل على cTrader. مع ذلك، تم اختبار المعلمات خصيصًا لـ XAUUSD. ستستفيد الأدوات الأخرى من فترة ضبط المعلمات.
⚠️ إخلاء المسؤولية عن المخاطر تداول العملات الأجنبية والسلع وعقود الفروقات بالهامش يحمل مستوى عاليًا من المخاطر وقد لا يكون مناسبًا لجميع المستثمرين. هذا المؤشر هو أداة تحليل كمي لأغراض تعليمية ومعلوماتية فقط — ولا يشكل نصيحة مالية. الأداء السابق لا يدل على النتائج المستقبلية. اختبر دائمًا على حساب تجريبي قبل المخاطرة برأس مال حقيقي.
الملخص
Key functionalities include dynamic Average True Range (ATR)-based stop loss and take profit target zones that adapt to market volatility, and a UI memory manager that keeps charts clear by displaying only the five most recent setups. Signals are visually represented by arrows: bright green for high-probability buy, bright red for high-probability sell, and gray for counter-trend momentum (not recommended for trading). The indicator supports multiple timeframes, with M8 as the default optimized setting balancing signal frequency and accuracy.
Additionally, it integrates Telegram push alerts via webhook, delivering real-time trade signals with precise entry, stop loss, and take profit levels. Users are advised to wait for signal candle closure before entering trades and to place stops and targets at the edges of the ATR target zones. Parameters such as learning window, prediction threshold, ATR period, and multipliers for stop loss and take profit are configurable to suit different trading styles.