
الوصف
TrendFallowing: هو مؤشر تقني متقدم لمنصة cTrader يجمع بين عدة أساليب تحليلية في حل واحد. تم تطويره للمتداولين الذين يبحثون عن تأكيد الاتجاه من خلال تقارب المؤشرات، ويوفر رؤية كاملة للسوق مع إشارات دقيقة ومرشحات تحقق.
شاهد الفيديو التمهيدي لاستراتيجية التشغيل!
🎯 استراتيجيات الاستخدام
1. التداول باتباع الاتجاه
التطبيق: تحديد واتباع الاتجاهات القائمة
الإطار الزمني: H4، D1 للمراكز الأطول
الإعدادات: ADX > 25، حجم التداول فوق المتوسط
إدارة المخاطر: وقف الخسارة تحت المتوسط المتحرك لفترة 50
2. التداول المتأرجح
التطبيق: التقاط الحركات متوسطة الأجل
الإطار الزمني: H1، H4
الإعدادات: تمكين فلتر الحجم، تأكيد بواسطة ملف الحجم
الأهداف: نقطة التحكم في ملف الحجم كهدف جني أرباح
3. التداول عند الاختراق
التطبيق: الدخول عند اختراق الدعم/المقاومة
الإعدادات: حجم PVA لتأكيد قوة الحركة
التأكيد: ارتفاع ADX + حجم فوق المتوسط
4. السكالبينج (أطر زمنية أقصر)
التطبيق: تداولات سريعة مع تأكيدات متعددة
الإطار الزمني: M1، M5
الإعدادات: فلاتر حجم صارمة وزخم
🔧 كيف تعمل المؤشرات
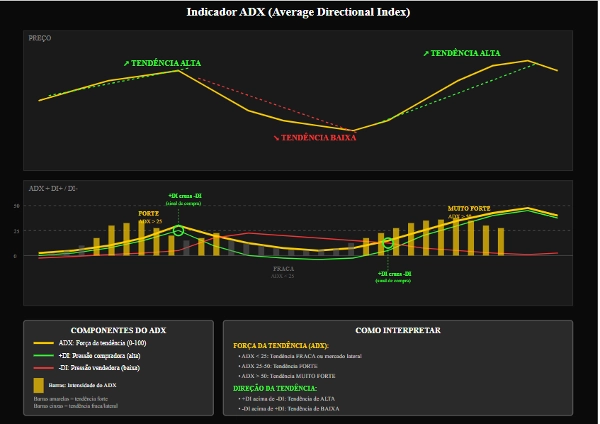
المؤشر الأساسي ADX & DI
ADX (مؤشر الاتجاه المتوسط)
الوظيفة: قياس قوة الاتجاه
التفسير:
0-25: اتجاه ضعيف/حركة جانبية
25-50: اتجاه قوي
50+: اتجاه قوي جداً
الاستخدام العملي: تجنب التداولات عندما يكون ADX < 20
+DI / -DI (مؤشرات الاتجاه)
+DI: قوة المشترين
-DI: قوة البائعين
الإشارة: تقاطع +DI فوق -DI (شراء) والعكس صحيح
ميل ADX (ADX Slope)
الوظيفة: قياس تسارع الاتجاه
الرسم: مخطط بياني بلون سماوي
الإشارة: القيم الإيجابية تشير إلى تقوية الاتجاه
فلاتر الحجم
فلتر المتوسط المتحرك للحجم
الوظيفة: التحقق من الإشارات بحجم تداول فوق المتوسط
المعلمات: فترة 20، المضاعف 1.0
الاستخدام: تأكيد الاهتمام المؤسسي
حجم PVA (تحليل حجم السعر)
الألوان والمعاني:
الأخضر: شراء بحجم مرتفع جداً (>150% المتوسط)
الأزرق: شراء بحجم مرتفع
الأحمر: بيع بحجم مرتفع جداً
الوردي: بيع بحجم مرتفع
الأصفر: شريط دبوس/نفاد مع كسر الدعم
ملف الحجم
نقطة التحكم (POC)
الوظيفة: السعر الذي تم التداول عنده بأعلى حجم
الاستخدام: هدف طبيعي للتداولات، دعم/مقاومة ديناميكية
منطقة القيمة
الوظيفة: المنطقة التي تم فيها تداول 70% من الحجم
التفسير:
السعر فوق: اتجاه صاعد
السعر تحت: اتجاه هابط
داخلي: احتمال حركة جانبية
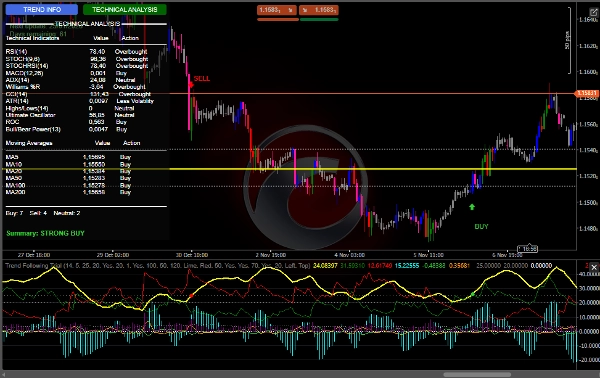
لوحة المؤشرات
RSI: تشبع بيع (<30) / تشبع شراء (>70)
MACD: الزخم
Williams %R: ظروف قصوى
CCI: تحديد الانعكاس
Stochastic: الزخم قصير الأجل
Ultimate Oscillator: الزخم متعدد الأطر الزمنية
المتوسطات المتحركة
مجموعة كاملة من المتوسطات المتحركة (5، 10، 20، 50، 100، 200)
تحليل التوافق للاتجاهات
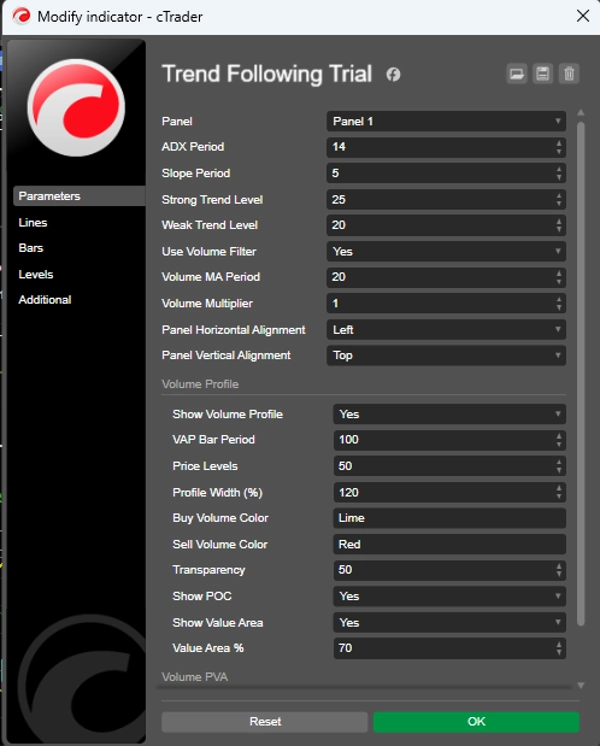
⚙️ الإعدادات الموصى بها
الإعداد المحافظ
فترة ADX: 14
فترة الميل: 5
مستوى الاتجاه القوي: 25
مستوى الاتجاه الضعيف: 20
استخدام فلتر الحجم: true
فترة المتوسط المتحرك للحجم: 20
مضاعف الحجم: 1.2
الإعداد العدواني
فترة ADX: 10
فترة الميل: 3
مستوى الاتجاه القوي: 20
مستوى الاتجاه الضعيف: 15
استخدام فلتر الحجم: true
فترة المتوسط المتحرك للحجم: 14
مضاعف الحجم: 1.0
ملف الحجم (موصى به)
عرض ملف الحجم: true
فترة شريط VAP: 100
مستويات السعر: 50
نسبة منطقة القيمة: 70
عرض نقطة التحكم: true
🎨 الموارد البصرية
واجهة المستخدم
لوحة ديناميكية: معلومات في الوقت الحقيقي
أزرار تفاعلية: التبديل بين التحليلات
ألوان بديهية: ترميز حسب الوظيفة
الإشارات الرسومية
الأسهم: دخول شراء/بيع
الأصوات: تنبيهات مسموعة
ألوان الأشرطة: تحليل PVA مدمج


