
Descripción
Completa tus estrategias con este indicador de señales👇🏻
https://ctrader.com/pt/products/1560?u=Goulart
✔Características del Indicador
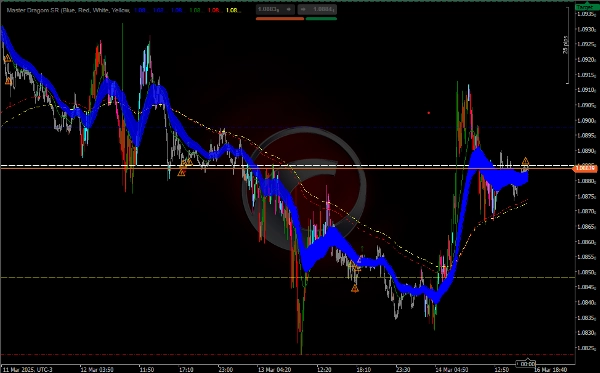
Soporte y Resistencia (SR):
El indicador dibuja líneas horizontales para niveles diarios, semanales y mensuales de soporte y resistencia.
Puedes activar o desactivar cada nivel (apertura, cierre, máximo y mínimo) según sea necesario.
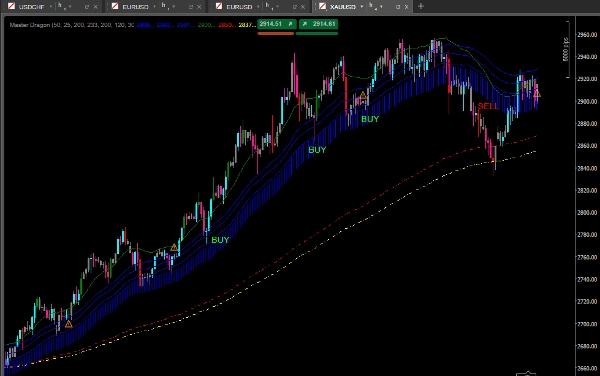
Medias Móviles Exponenciales (EMA):
El indicador calcula múltiples EMAs (50, 25, 200 y 233 períodos) para ayudar a identificar tendencias y posibles áreas dinámicas de soporte/resistencia.
Las EMAs se representan en el gráfico con diferentes colores para facilitar la visualización.
Análisis de Volumen (PVAVolumeAnalysis):
El indicador analiza el volumen para identificar posibles reversiones o continuaciones de tendencia.
Resalta barras con volumen superior al promedio y señala cambios significativos en el volumen con iconos (↑, ↓, ⚠️).
Coloreado de Barras:
Las barras se colorean según el volumen y la dirección del precio (alcista o bajista), lo que ayuda a identificar la fuerza de la tendencia.
Análisis de Tendencia con EMAs:
Usa las EMAs para identificar la dirección de la tendencia:
Si el precio está por encima de las EMAs (especialmente las EMAs de 200 y 233), la tendencia es alcista.
Si el precio está por debajo de las EMAs, la tendencia es bajista.
El área entre el EMA 50 Alto y Bajo puede usarse como zona de interés para posibles reversiones o continuaciones.
Análisis de Volumen:
Observa los iconos y colores de las barras para identificar cambios en el volumen:
Volumen alto con precio subiendo (↑): Confirmación de una tendencia alcista.
Volumen alto con precio bajando (↓): Confirmación de una tendencia bajista.
Volumen bajo con precio subiendo o bajando (⚠️): Posible reversión.
Combinación de Señales:
Combina las señales de volumen, EMAs y niveles SR para tomar decisiones de entrada o salida.
Por ejemplo, si el precio está cerca de un nivel de resistencia y el volumen está disminuyendo, podría ser una señal de reversión.
Estrategia Sugerida
Estrategia de Tendencia con Confirmación de Volumen
Identifica la Tendencia:
Usa las EMAs (200 y 233) para determinar la tendencia principal.
Si el precio está por encima de las EMAs, considera solo compras.
Si el precio está por debajo de las EMAs, considera solo ventas.
Espera un Retroceso:
Espera a que el precio regrese a una EMA de período más corto (50 o 25) o a un nivel SR.
Confirma con Volumen:
Verifica si el volumen está aumentando en la dirección de la tendencia (↑ para compras, ↓ para ventas).
MA localiza tendencias, retrocesos, señales de volumen, reversiones, soporte y resistencia.
Si el volumen está disminuyendo (⚠️), evita entrar o considera una reversión.
Entrada:
Compra cuando el precio esté por encima de las EMAs y cerca de un nivel de soporte, con volumen que confirme la tendencia alcista.
Vende cuando el precio esté por debajo de las EMAs y cerca de un nivel de resistencia, con volumen que confirme la tendencia bajista.
Salida:
Usa los niveles SR o las EMAs como objetivos o puntos de salida.
Por ejemplo, cierra o vende cuando alcance un nivel de soporte.
Resumen
Volume analysis is integrated to detect potential trend reversals or continuations by highlighting bars with above-average volume and signaling significant volume changes using icons (↑ for rising volume confirming uptrends, ↓ for falling volume confirming downtrends, and ⚠️ for low volume indicating possible reversals). Bars are color-coded based on volume and price direction to visually represent trend strength.
Traders can combine signals from volume, EMAs, and support/resistance levels to make informed entry and exit decisions. A suggested strategy involves identifying the main trend using the 200 and 233 EMAs, waiting for pullbacks to shorter EMAs or support/resistance levels, and confirming with volume signals before entering trades. Exit points can be set at support/resistance levels or EMA lines. This indicator is suitable for enhancing trend, pullback, volume, reversal, and support/resistance analysis in various trading strategies.
Valoraciones de clientes
5 | 100 % | |
4 | 0 % | |
3 | 0 % | |
2 | 0 % | |
1 | 0 % |


