설명
이 지표는 Smart Money Market Theory (ICT/SMC)의 개념을 따라 시장에서 유동성 구역과 주문 블록을 식별합니다.
https://ctrader.com/pt/products/1560
https://ctrader.com/pt/products/1386
이 지표는 네 가지 주요 단계로 작동합니다:
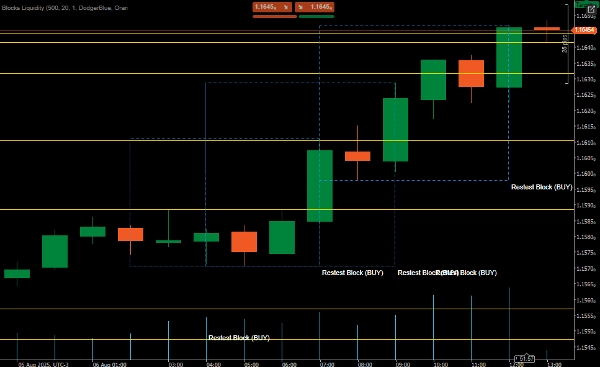
✅주문 블록 식별
충격적인 움직임 감지 (기본값 최소 20 핍)
충격 전의 통합 구역 찾기
매수 또는 매도 블록으로 분류
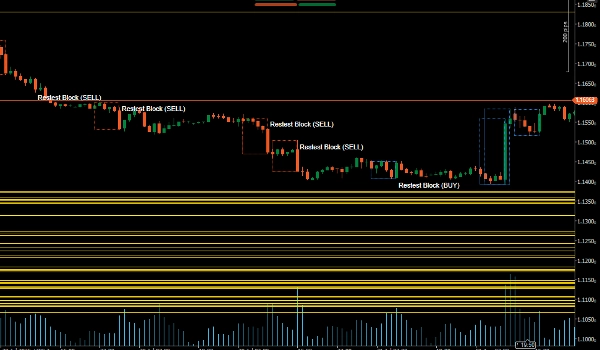
✅유동성 풀 식별
최근 고점과 저점을 유동성 구역으로 표시
이 구역들은 잠재적 목표 또는 정지 지점을 나타냄
✅재테스트 확인
가격이 주문 블록으로 돌아올 때 확인
반전 패턴 (핀 바/엔걸핑) 및 거래량으로 확인
✅차트 시각화
주문 블록과 유동성 구역을 그림
확인 시 음성 알림 발생
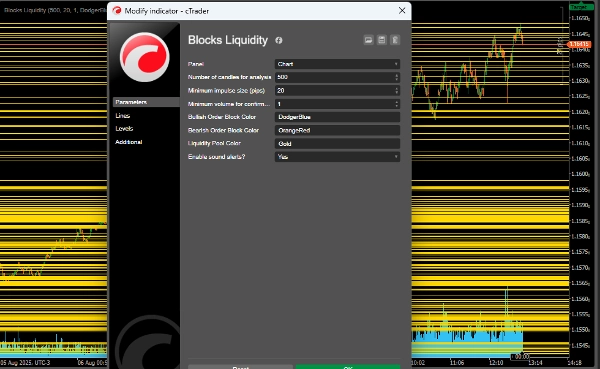
✅설정 가능한 매개변수
LookbackPeriod: 분석할 캔들 수 (기본값 500)
MinImpulsePips: 충격 움직임의 최소 크기 (20 핍)
MinVolumeThreshold: 확인을 위한 최소 거래량 (1.0)
강세/약세 블록 및 유동성 구역에 대한 사용자 지정 색상
음성 알림 옵션
✅거래 논리
강세 (매수) 블록:
통합과 상승 모멘텀 후 형성
잠재적 지지 구역
재테스트 시 반전 패턴 + 거래량으로 진입 확인
약세 (매도) 블록:
통합과 하락 모멘텀 후 형성
잠재적 저항 구역
동일한 방식으로 진입 확인
✅유동성 풀:
최근 고점/저점을 목표 또는 정지 지점으로 사용
스톱 주문이 집중될 가능성이 있는 구역
요약
Key features include:
- Order Block Identification: Detects bullish and bearish blocks formed after consolidation and momentum shifts, serving as potential support or resistance zones.
- Liquidity Pool Identification: Highlights recent highs and lows that may act as targets or stop areas due to stop order concentration.
- Retest Confirmation: Validates entries by checking price returns to order blocks combined with reversal candlestick patterns (Pin Bar, Engulfing) and volume thresholds.
- Chart Visualization: Draws order blocks and liquidity zones with customizable colors and provides sound alerts upon confirmation.
- Configurable parameters such as lookback period, minimum impulse size, and volume threshold allow adaptation to different trading preferences.
This indicator supports analysis of price action dynamics to assist traders in identifying key market levels and potential trade entry points.
고객 리뷰
5 | 100 % | |
4 | 0 % | |
3 | 0 % | |
2 | 0 % | |
1 | 0 % |