الوصف
مؤشر الدعم والمقاومة للأرقام المستديرة
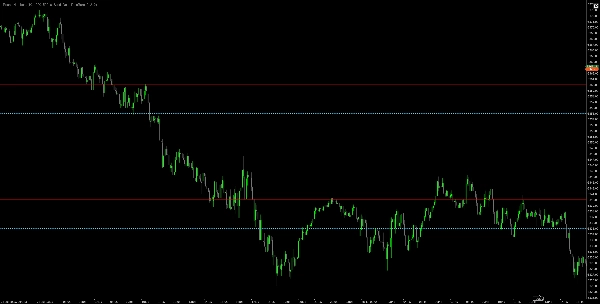
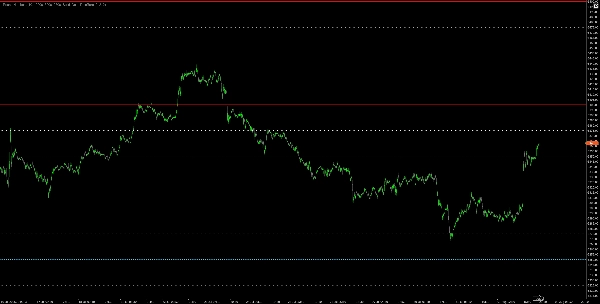
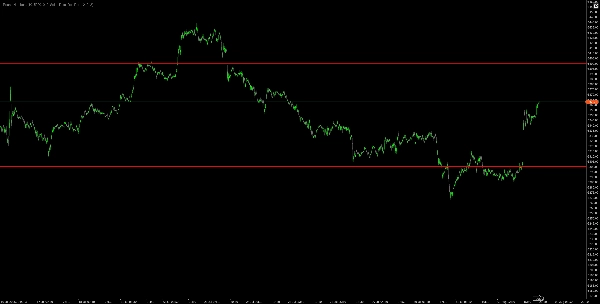
يقوم هذا المؤشر القوي برسم خطوط دعم ومقاومة أفقية تلقائيًا عند مستويات الأرقام المستديرة المهمة نفسيًا على الرسم البياني الخاص بك. كما يعلم أي متداول ذو خبرة، تميل الأسعار إلى التفاعل بقوة عند الأرقام المستديرة مثل 1.2000، 1.2100، 1.2050 لأن هذه المستويات تمثل حواجز نفسية حيث يضع المتداولون أوامرهم.
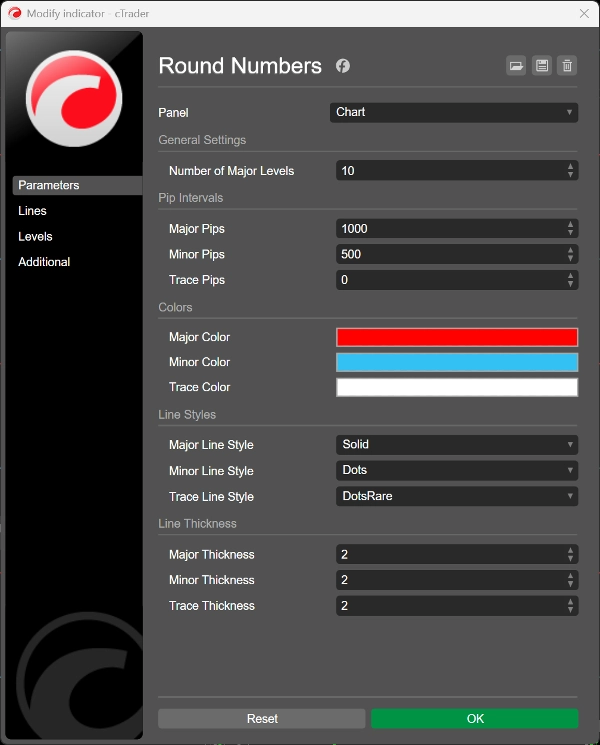
ما يفعله ببساطة: 📊 يرسم ثلاثة أنواع من الخطوط بناءً على فواصل النقاط التي تختارها:
- المستويات الرئيسية (حمراء، خطوط متصلة) - أقوى المستويات النفسية (عادة كل 100 نقطة)
- المستويات الثانوية (زرقاء، خطوط منقطة) - المستويات الثانوية (عادة كل 50 نقطة)
- مستويات التتبع (بيضاء، نقاط متفرقة) - مستويات أدق (عادة كل 25 نقطة)
الميزات الرئيسية:
✅ فواصل نقاط قابلة للتخصيص بالكامل لكل نوع من المستويات
✅ اختر ألوانك وأنماط الخطوط الخاصة بك لرؤية مثالية على الرسم البياني
✅ يتم التحديث تلقائيًا مع تحرك السعر لعرض المستويات ذات الصلة دائمًا
✅ مظهر نظيف واحترافي لا يزدحم على رسومك البيانية
✅ يعمل على جميع الأطر الزمنية وأزواج العملات
✅ ضع 0 لإخفاء المستويات غير المرغوب فيها
الملخص
Key features include full customization of pip intervals, colors, and line styles for each level type, ensuring clear chart visibility. The indicator updates dynamically as prices move to maintain relevant support and resistance lines. It is designed to provide a clean, professional appearance without cluttering charts and is compatible with all timeframes and currency pairs. Users can disable any level type by setting its interval to zero.
This tool supports multiple markets including Forex, indices, commodities, cryptocurrencies, and stocks, making it versatile for various trading strategies that rely on psychological price barriers.
تقييمات العملاء
5 | 67 % | |
4 | 0 % | |
3 | 0 % | |
2 | 33 % | |
1 | 0 % |