
VolumeThermometer
Gösterge
426 i̇ndirmeler
Sürüm 1.0, Aug 2025
Windows, Mac
Başlangıç 26/05/2025
451.48M
İşlem hacmi
61.16K
Kazanılan pip
15
Satışlar
1.43K
Ücretsiz yüklemeler
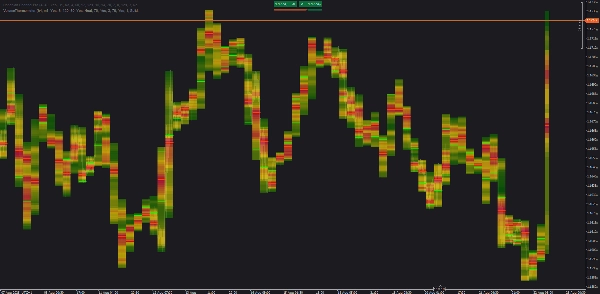
Açıklama
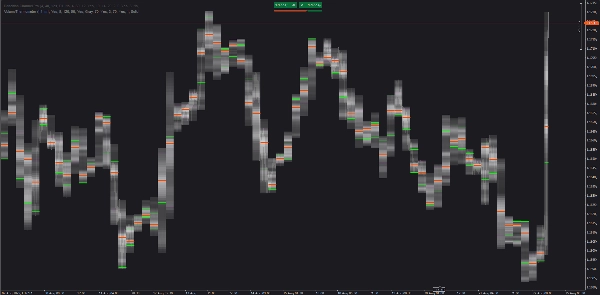
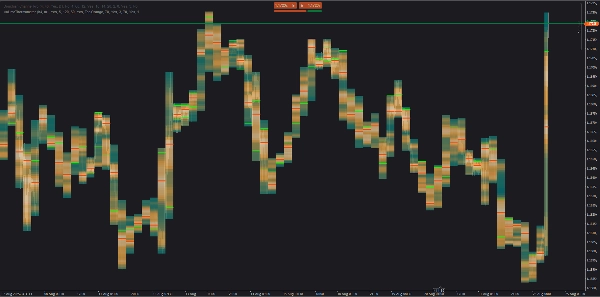
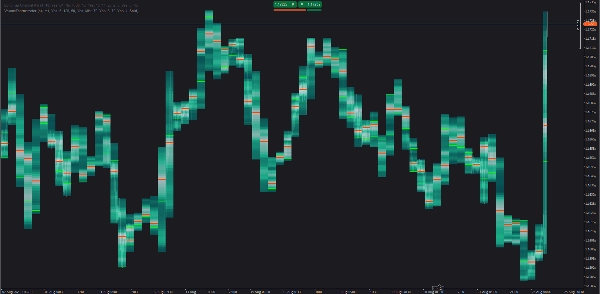
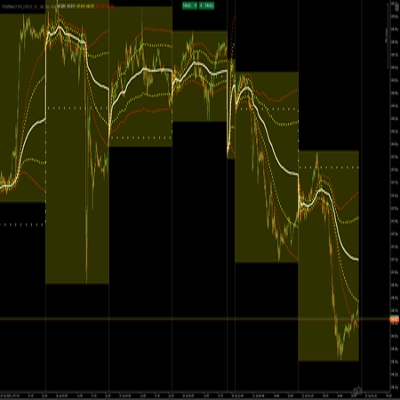
Hacim dağılımını gösteren bir cTrader ısı haritası her HTF mumunun içinde. Dikey hacim kutuları oluşturmak için LTF çubuklarını (örneğin, M1) kullanır, ardından POC ve Değer Alanı (VA) çizgilerini çizer. Mevcut (tamamlanmamış) HTF mumu gerçek zamanlı olarak boyanır.
Nasıl çalışır
- LTF çubuklarından tick hacmini toplar.
- Her HTF mumunu
Kutularafiyat dilimlerine böler ve hacmi fiyat örtüşmesine göre atar. - Kutuları göreceli hacme göre renklendirir; POC, isteğe bağlı VA çizgilerini çizer ve bunları sağa uzatabilir.
- Sadece görünür aralık için eski geçmişi otomatik yükler (küçük partiler halinde).
Kullanımı
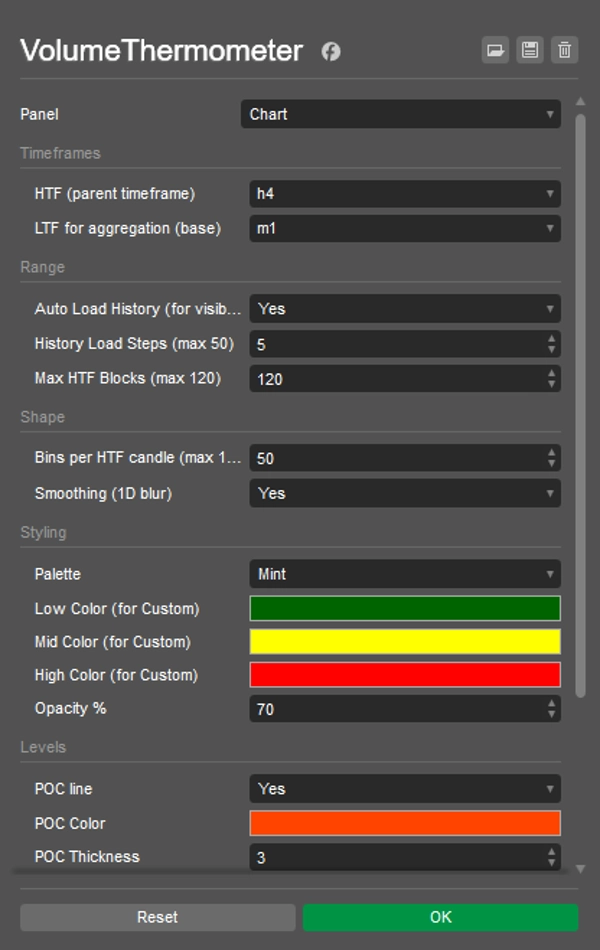
- HTF (örneğin, H4) ve LTF (örneğin, M1) seçin.
- Otomatik Geçmiş Yükleme özelliğini etkinleştirin; istediğiniz aralığa kaydırın/zoom yapın.
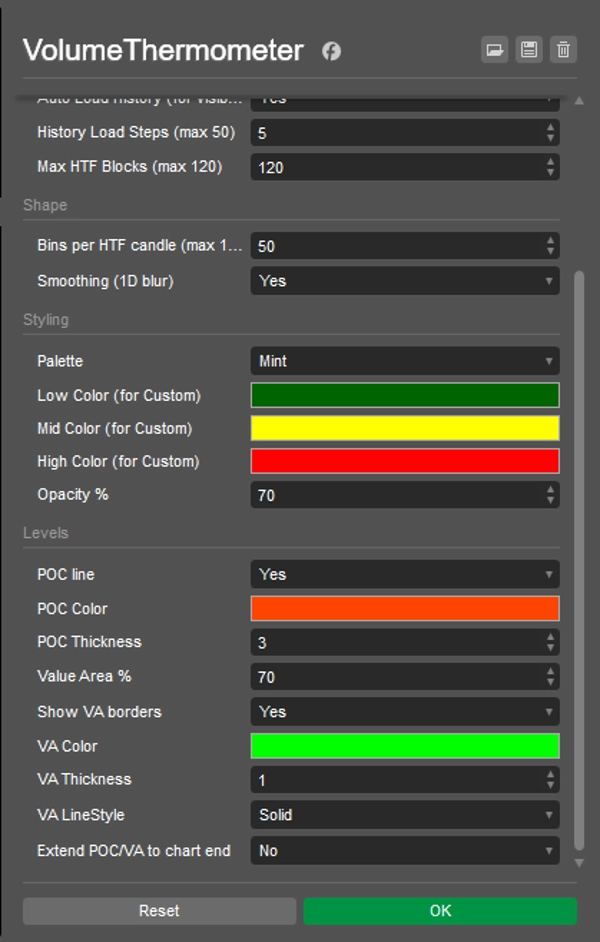
- Kutuları (detay), Maksimum HTF Blokları (gösterilecek mum sayısı), Yumuşatma, Opaklık ve renkleri ayarlayın.
- POC/VA tepkilerini ve POC'un mumdan muma nasıl hareket ettiğini izleyin.
Hızlı fikirler
- POC yeniden testi: Önceki POC'un ilk dokunuşu ve LTF onayı.
- VA rotasyonu: VA'ya yeniden giriş genellikle POC/diğer VA kenarını hedefler.
- LVN geçişi: İnce (soğuk) alanlar genellikle bir sonraki düğüme hızlı hareket eder.
Notlar
- tick hacmi kullanır (FX/CFD için iyi bir vekil, borsa hacmi değil).
- Performans için gerekirse Kutuları veya Maksimum HTF Blokları azaltın.
Özet
YZ özeti
VolumeThermometer is a cTrader indicator that visualizes intra-higher timeframe (HTF) volume distribution using a heatmap. It aggregates tick volume data from lower timeframe (LTF) bars (e.g., M1) to construct vertical volume bins within each HTF candle (e.g., H4). The indicator highlights the Point of Control (POC) and Value Area (VA) lines, showing where the most volume is concentrated by price level. The current HTF candle is updated in real time, and the indicator automatically loads historical data for the visible chart range in small batches to optimize performance.
Key features include:
- Aggregation of tick volume from LTF bars.
- Division of HTF candles into price bins with volume assigned by price overlap.
- Color-coded volume bins indicating relative volume intensity.
- Display of POC and optional VA lines, with the ability to extend these lines forward.
- Customizable settings for bin detail, maximum HTF candles displayed, smoothing, opacity, and colors.
- Supports multiple markets including Forex, indices, commodities, stocks, and cryptocurrencies such as BTCUSD and EURUSD.
Users can monitor POC retests, VA rotations, and low volume node pass-throughs to analyze volume behavior within HTF candles. The indicator uses tick volume as a proxy, suitable for FX and CFD markets.
Gösterge profili
Müşteri değerlendirmeleri
0.0
Değerlendirmeler: 0
Müşteri değerlendirmeleri
Bu ürün için henüz bir değerlendirme yok. Ürünü denediniz mi? O zaman ona dair görüşlerini paylaşan ilk kişi olun!
Tartışma
SSS
BTCUSD
Prop
Forex
Indices
EURUSD
Commodities
Crypto
Stocks
NAS100
cTrader Store üzerinden erişilebilen işlem botları, göstergeler ve eklentiler gibi ürünler, üçüncü taraf sağlayıcılar tarafından sağlanır ve yalnızca bilgilendirme ve teknik erişim amaçlarıyla sunulur. cTrader Store bir broker değildir ve yatırım tavsiyesi, kişisel öneriler vermez veya gelecekteki performansı garanti etmez.


Fiyat
Başlangıç 26/05/2025
451.48M
İşlem hacmi
61.16K
Kazanılan pip
15
Satışlar
1.43K
Ücretsiz yüklemeler