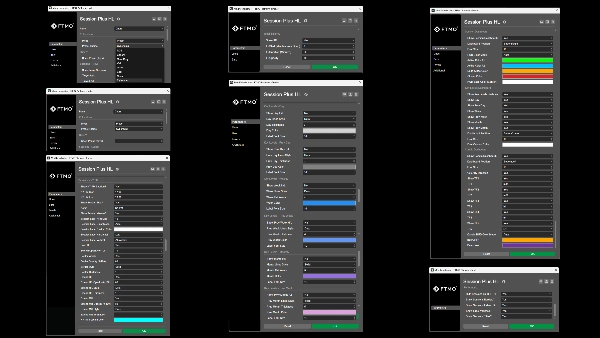
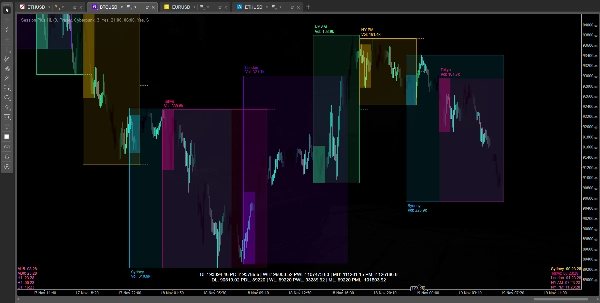
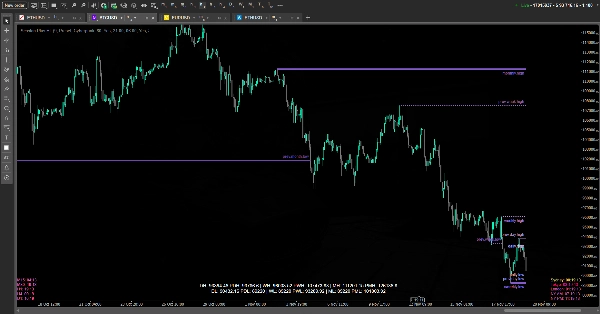
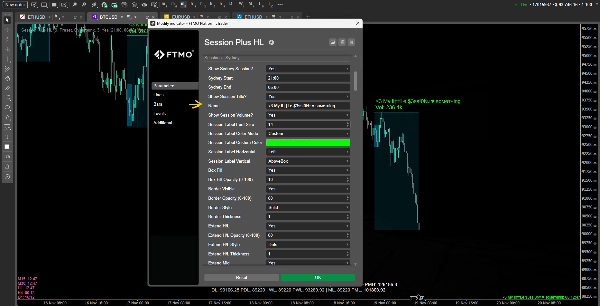
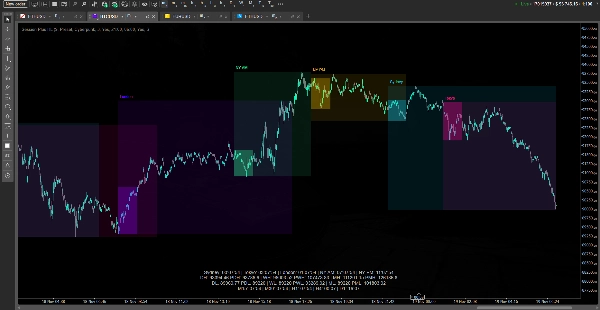
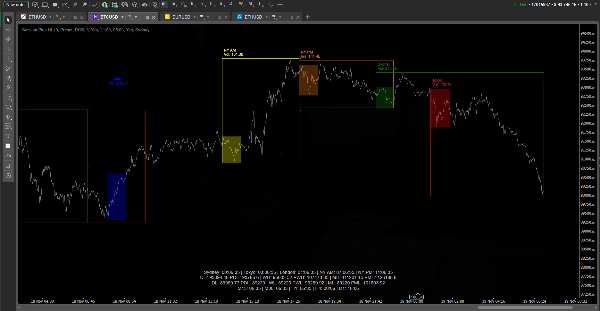
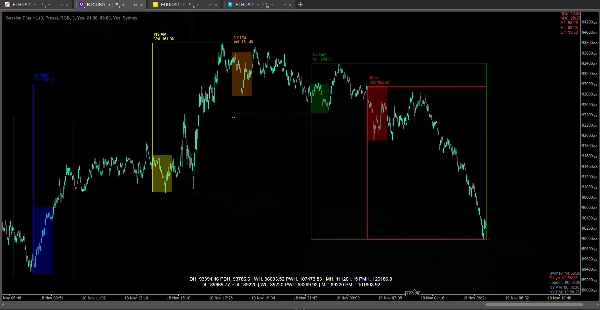
"Session Plus HL" logosu
Session Plus HL
"Session Plus HL" yüklenen resmi
Başlangıç 26/05/2025
347.31M
İşlem hacmi
59.74K
Kazanılan pip
12
Satışlar
1.1K
Ücretsiz yüklemeler

This indicator is designed to visualize market structure and time-based context for intraday traders. It automatically plots key trading sessions (Sydney, Tokyo, London, New York AM/PM) as boxes on the chart, shows their high/low and optional mid levels, and can highlight an Initial Balance (IB) range inside each session. It also draws key reference levels from higher timeframes — current and previous day/week/month highs and lows — and displays them both as lines on the chart and as a compact dashboard, so you always see where price is relative to recent liquidity pools.

On top of that, the indicator provides several HUDs: a session dashboard showing how long remains until each session opens or closes, a key levels dashboard summarizing all daily/weekly/monthly H/L values, and a candle dashboard that shows time remaining in candles on multiple higher timeframes and their bullish/bearish state. All visuals are theme‑able (color presets or custom colors), can be tuned for performance (hiding sessions on higher TFs, controlling line stubs instead of heavy dynamic extensions), and are meant to support analysis of liquidity sweeps, session ranges, and timing without cluttering or slowing the chart.

Gösterge profili
0.0
Değerlendirmeler: 0
Müşteri değerlendirmeleri
Bu ürün için henüz bir değerlendirme yok. Ürünü denediniz mi? O zaman ona dair görüşlerini paylaşan ilk kişi olun!
BTCUSD
Forex
Signal
Breakout
Indices
EURUSD
Commodities
GBPUSD
NZDUSD
Prop
ZigZag
Scalping
Supertrend
Fair Value Gap
SMC
Crypto
Stocks
XAUUSD
NAS100
ATR
USDJPY
VWAP
cTrader Store üzerinden erişilebilen işlem botları, göstergeler ve eklentiler gibi ürünler üçüncü taraf sağlayıcılar tarafından sağlanır ve yalnızca bilgilendirici ve teknik erişim amaçları için sunulur. cTrader Store bir broker değildir ve yatırım tavsiyesi, kişisel öneriler vermez veya gelecekteki performansı garanti etmez.

Bu oluşturanın diğer ürünleri

Heatmap of intra-HTF volume (POC/VA) built from LTF tick data; paints current candle and auto-loads visible history.
Right-anchored cTrader Volume Profile with VAH/VAL/POC, LVZ, top volume+EMA, themes, and fast, readable visuals.
Candle Volume Profile for Crypto
Overlay HTF context on any chart: color bars by HTF and draw filled HTF bodies with optional High/Low lines.
Pro VSA tool with 3 modes: Fixed Ratios, Standard Deviation & Contextual VSA.
Tracks N-period highs/lows, HTF overlay, HUDs with ADX, RSI, session clocks. Customizable for precise trading.
10 configurable moving averages: choose type, period, color per line; single price source for all.
Edge-aware clouds + Pro HUD: better entries, calmer exits, adaptive risk.
Market entropy + DC. Spot crystallization/chaos shifts with an optional on-chart overlay.
A multi-TF panel with candle timers, sessions, ticker, spread & 15+ themes. Fully customizable.

Şunları da beğenebilirsiniz

Multi-timeframe liquidity heatmap. Visualizes pivot zones across 10 timeframes with density mapping for Smart Money trad
Overbought Oversold Indicator ctrader
Customize the MACD! Choose colors, get real-time tick updates, and see crossover points for enhanced trading precision.
SUPER TREND Oscillatore
A precision-crafted indicator that compares current volume to its historical average for the same time of day.
Visual risk management terminal for cTrader. Set Lot size, SL, and TP via chart lines with real-time PnL projections.
Stop drawing levels manually. SmartLevels Pro detects, scores & predicts — H4/H1/M15 · cTrader
Intraday MultiTimeframe Candle Status Indicator
This technical analysis indicator provides information on market sentiment, trend and price levels....
A multi-TF panel with candle timers, sessions, ticker, spread & 15+ themes. Fully customizable.
Daily/Weekly/Monthly - Highs & Lows Indicator (Customizable Settings)
Fear & Greed engine — detects institutional overheating with BB + Percentile signals.
RSI, MACD, Stochastic, CCI & Momentum divergence scanner with confluence scoring. Never miss a signal again!
🚀 TrendHeikinMultiMA: Advanced trend detection using Heikin-Ashi smoothing & MAs! Eliminates noise, confirms real trend
Custom ADX Indicator for precise trend analysis. المؤشر المخصص ADX لتحليل الاتجاه بدقة
Cross EMA Pro – Trend Reversal Indicator
Plots daily, 4 hourly or one hourly Point of Control line.
A straightforward yet effective tool signals entry points for both buying and selling. Include 3 Moving Average
Başlangıç 26/05/2025
347.31M
İşlem hacmi
59.74K
Kazanılan pip
12
Satışlar
1.1K
Ücretsiz yüklemeler