


설명
SMC Smart Money Suite Pro — cTrader용 완전한 기관 가격 행동 도구 키트
스마트 머니 개념이나 기관 주문 흐름에 뿌리를 둔 가격 행동 방법론을 사용하여 거래하는 경우, 차트에 흩어져 있는 여러 지표들이 각각 부분적으로만 역할을 수행하고 서로 소통하지 않는 고통을 잘 아실 것입니다. Smart Money Suite Pro는 이를 완전히 해결하기 위해 만들어졌습니다.
이것은 기관 가격 행동 및 스마트 머니 방법론 내의 모든 주요 개념을 포괄하는 단일 독립형 지표로, cTrader를 위해 처음부터 설계되었으며, 깜박임 없이 라이브 차트에서 원활하게 실행되도록 최적화되었고, 실제 거래 세션에서 진정으로 사용할 수 있도록 편의 기능이 가득합니다.
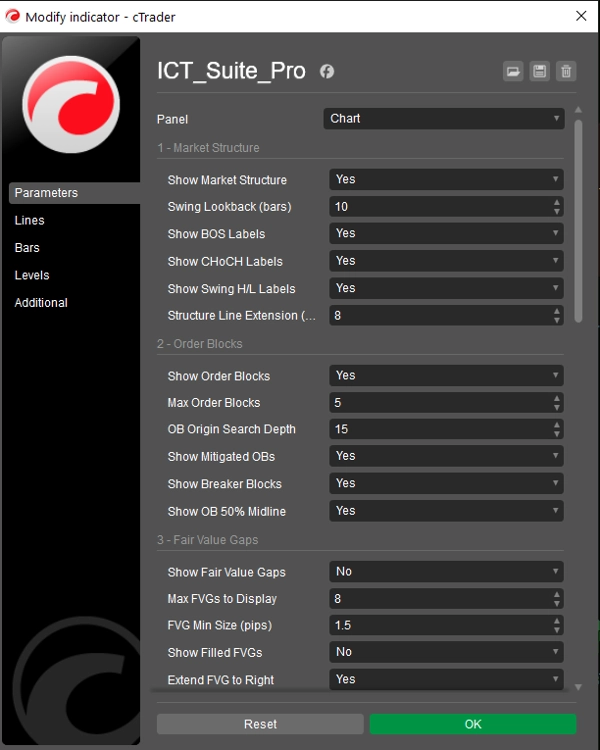
시장 구조 — 자동 및 정밀
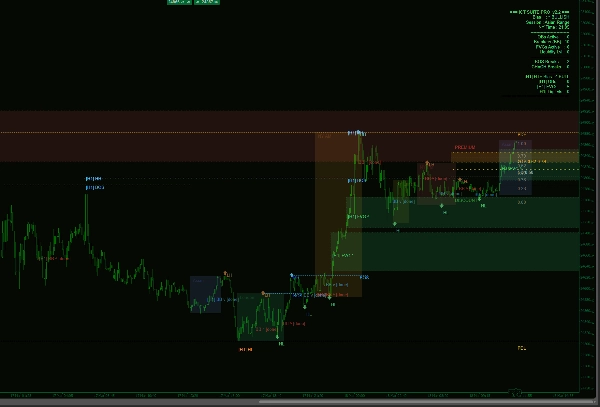
이 지표는 차트를 지속적으로 스캔하여 확인된 스윙 고점과 저점을 찾아 각각을 Higher High, Lower High, Higher Low, 또는 Lower Low로 분류합니다. 모든 구조 붕괴(BOS)와 성격 변화(CHoCH)는 감지되어 점선 레벨 라인으로 표시되어 가격이 이전 구조를 정확히 어디서 깼는지 볼 수 있습니다. BOS(추세 지속)와 CHoCH(추세 반전)의 구분은 색상으로 구분되어 한눈에 즉시 읽을 수 있습니다. 스윙 되돌아보기 깊이는 완전히 조정 가능합니다.
오더 블록 — 전체 수명 주기 추적 포함
오더 블록은 확인된 스윙으로 이어진 각 임펄스 이동 전의 마지막 반대 캔들을 찾아 식별합니다. 각 블록은 차트 오른쪽으로 확장되는 색상 박스로 그려져 가격이 해당 구역으로 돌아왔는지 한눈에 볼 수 있습니다. 오더 블록이 완화되면 사각형이 제거되고 희미한 텍스트 마커로 대체되어 차트를 깔끔하게 유지하면서 레벨 기록을 보존합니다. 이후 가격이 완화된 오더 블록의 반대편을 침범하면, 해당 블록은 브레이커 블록으로 재분류되고 색상이 변경되어 잠재적 반전 구역을 알립니다. 각 활성 블록 내부에는 50% 중간선이 그려져 구역 내 프리미엄/할인 구분을 강조합니다.
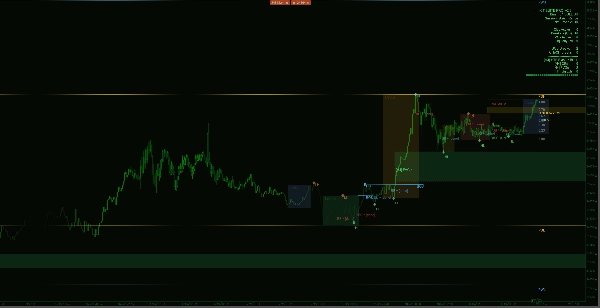
공정 가치 갭 — 채워질 때까지 추적
3캔들 가격 불균형이 전체 되돌아보기 창에서 양방향으로 감지됩니다. 각 갭은 노이즈를 제거하기 위해 구성 가능한 최소 핍 크기로 필터링됩니다. 채워지지 않은 갭은 가격이 이를 닫을 때까지 차트 오른쪽으로 확장되며, 설정에 따라 제거되거나 채워진 것으로 표시됩니다. 강세 및 약세 불균형이 동시에 처리됩니다.
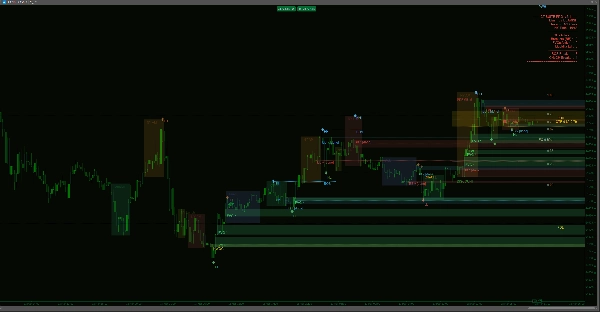
유동성 레벨 — 동일 고점 및 동일 저점
이 지표는 서로 구성 가능한 핍 허용 오차 내에 위치한 스윙 고점 또는 저점 클러스터를 스캔하여 기관 주문 흐름이 주로 목표로 하는 매수 및 매도 유동성 풀을 식별합니다. 각 레벨은 양쪽 스윙 지점에 틱 마크와 오른쪽으로 투영된 점선으로 그려집니다. 가격이 유동성 레벨을 통과하면 사용자의 선호에 따라 숨기거나 통과된 것으로 표시됩니다.
주요 레벨 — 이전 일, 주, 월
이전 일 고가/저가, 이전 주 고가/저가, 이전 월 고가/저가는 차트 자체의 가격 데이터에서 자동으로 계산됩니다. 모든 날짜 경계는 브로커의 바 타임스탬프에서 파생되므로 로컬 시스템 시계와 무관하게 시간대나 상품 롤오버에 관계없이 정확성을 유지합니다. 각 레벨 쌍은 차트에 깔끔하게 겹치도록 고유한 색상과 선 스타일을 사용합니다.
개장 갭 — 일간 및 주간
이 지표는 이전 세션 종가와 현재 세션 시가 사이의 가격 갭을 위해 매일 및 매주 개장을 스캔합니다. 정의된 최소 핍 크기를 초과하는 모든 갭은 색상 사각형으로 그려집니다. 새로운 일간 개장 갭과 새로운 주간 개장 갭은 서로 다른 색상으로 구분되어 어떤 갭이 아직 채워지지 않았는지 즉시 알 수 있습니다.
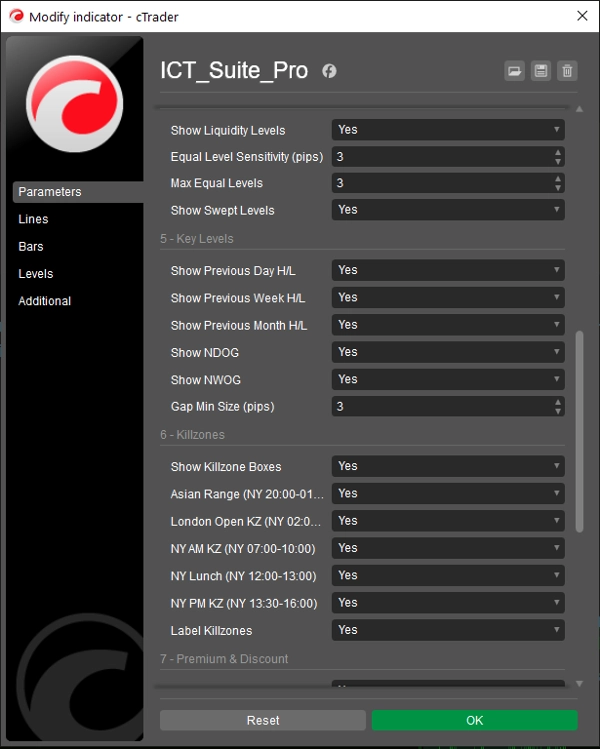
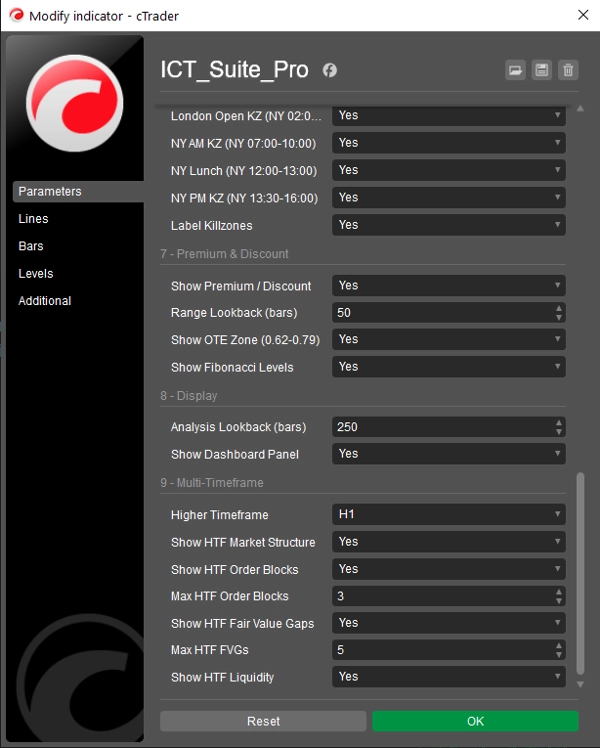
세션 킬존 — 실제 범위 박스 포함
아시아, 런던 오픈, 뉴욕 오전, 뉴욕 점심, 뉴욕 오후 세션 창은 각 기간 동안 형성된 실제 고가-저가 범위를 가득 채운 박스로 그려집니다. 시간은 뉴욕 시간을 기준으로 하며 EDT/EST 일광 절약 시간에 자동으로 조정됩니다. 각 박스는 개별적으로 토글 및 라벨 지정할 수 있습니다. 박스가 고정된 수직선이 아닌 실제 가격 범위를 반영하기 때문에 각 세션이 얼마나 활발했는지와 가격이 어디에서 극단에 도달했는지 즉시 확인할 수 있습니다.
프리미엄 & 할인 구역 — 최적 진입 범위 포함
롤링 범위 분석은 구성 가능한 되돌아보기 기간 동안 최고 고점과 최저 저점을 계산합니다. 이 범위에서 지표는 균형점(0.50), 최적 진입 구역(0.62–0.79 피보나치), 그리고 전체 주요 피보나치 되돌림 레벨 세트를 그립니다. 프리미엄 및 할인 라벨은 범위 내에 배치되어 현재 거래 범위의 어느 절반에서 가격이 거래되고 있는지 항상 알 수 있습니다. 되돌아보기는 자동으로 보이는 바 창에 맞게 제한되어 보이지 않는 바를 참조하는 레벨이 없습니다.
다중 시간대 오버레이 — 돋보이는 기능
MTF 시스템은 현재 차트의 바를 시간 정렬된 슬롯으로 집계하여 상위 시간대 캔들을 재구성합니다 — 별도의 데이터 구독이 필요 없습니다. 드롭다운에서 상위 시간대(M5, M15, M30, H1, H4, D1)를 선택하면 Smart Money Suite Pro가 현재 차트 위에 상위 시간대 오더 블록, 공정 가치 갭, 시장 구조, 유동성 레벨을 계산하고 그립니다. 상위 시간대 항목은 더 두꺼운 테두리, 점선 윤곽선, 시간대 태그가 접두사로 붙은 라벨(예: [H4] OB ^)로 시각적으로 구분되어 어느 시간대 레벨인지 항상 알 수 있습니다.
현재 차트 시간대와 같거나 낮은 상위 시간대를 선택하면 — 불가능한 구성 — 지표는 화면에 명확한 경고를 표시하고 아무 것도 그리지 않아 오해의 소지가 있는 데이터가 나타나는 것을 방지합니다.
오버레이가 활성화되면 대시보드 패널은 전용 상위 시간대 섹션으로 업데이트되어 HTF 바이어스, 활성 오더 블록 수, 공정 가치 갭 수, 유동성 레벨 수를 현재 시간대 요약과 함께 표시합니다.
라이브 대시보드
깔끔하고 오른쪽에 고정된 패널은 현재 시장 바이어스, 활성 거래 세션, 뉴욕 시간, 모든 활성 오더 블록, 브레이커 블록, 공정 가치 갭, 유동성 레벨 수, 그리고 되돌아보기 창에서 감지된 BOS 및 CHoCH 붕괴 총 수를 표시합니다. 다중 시간대 오버레이가 활성화되면 상위 시간대 요약이 자동으로 아래에 추가됩니다.
실시간 거래용으로 제작됨
지표는 새 바가 형성될 때만 다시 그려지며 — 모든 들어오는 틱마다가 아니라 — 많은 올인원 지표에 영향을 주는 차트 깜박임을 제거합니다. 모든 분석은 구성 가능한 되돌아보기 창 내에서 실행되어 낮은 시간대에서 바 수가 많아도 성능이 일관되게 유지됩니다.
요약
고객 리뷰
5 | 50 % | |
4 | 50 % | |
3 | 0 % | |
2 | 0 % | |
1 | 0 % |


