Açıklama
SmartFractalZigZag Plus — Akıllı Fraktallar, ZigZag, Otomatik Fibonacci ve Dinamik S/R Bölgeleri
════════════════════════════════════════════════════════════════════════════════
ÜRÜN GENEL BAKIŞI
SmartFractalZigZag Plus, KDE, HTF uyumu ve bir SR Trend Eğilimi paneli ile kantitatif S/R bölgeleri sunar, ayrıca S/R bölgeleri içinde otomatik Fibonacci takviyesi sağlar.
SmartFractalZigZag Plus, cTrader için SmartFractalZigZag ailesinin kurumsal düzeydeki sürümüdür.
Geçmişe dayanıklı fraktal motoru, temiz ZigZag salınımları ve Pro'dan tam otomatik Fibonacci geri çekilmeleri/uzantılarını dinamik Destek & Direnç Bölgesi motoru, çok zaman dilimli uyum tespiti ve Boğa/Ayı Trend Eğilimi paneli ile birleştirir.
Motorun altında, Plus basit bir "dokunuşları say" göstergesi yerine kantitatif bir S/R modeli olarak inşa edilmiştir. Yapısal olarak geçerli fraktal dönüm noktaları üzerinde çekirdek yoğunluk tahmini, ATR-normalize edilmiş mesafeler, logit alanı kanıt birleştirmesi ve üssel zaman azalması kullanarak ham fiyat hareketini her bölge için stabil olasılık benzeri bir güç skoruna dönüştürür.
Plus, fiyatın sadece nerede döndüğünü değil, her bölgenin ne kadar güçlü olduğunu, testlere nasıl tepki verdiğini ve daha yüksek zaman dilimi yapısının mevcut grafiği nasıl sessizce desteklediğini görmek isteyen traderlar için tasarlanmıştır. Tasarım, SMC/ICT, Wyckoff, Dow Teorisi, Chan teorisi ve klasik Fibonacci ticaretinden fikirler alır ve bunları tek, tutarlı bir motor halinde damıtır.
════════════════════════════════════════════════════════════════════════════════
ÖZELLİK KARŞILAŞTIRMASI (Pro vs Plus)
Hem Pro hem de Plus şunları içerir:
• Akıllı fraktal tespiti & aynı yön filtreleme
• ZigZag salınım bağlantıları
• Gerçek zamanlı otomatik Fibonacci
Sadece Plus özellikleri:
• Dinamik S/R bölgeleri (KDE yoğunluk ısı haritası)
• HTF S/R uyumu
• SR Trend Eğilimi (Boğa/Ayı endeksi + panel)
════════════════════════════════════════════════════════════════════════════════
TEMEL YAPI ÖZELLİKLERİ (Sürümler Arasında Paylaşılan)
────────────────────────────────────────────────────────────────────────────────
1. AKILLI FRAKTAL TESPİTİ
Fraktallar piyasa yapı analizinin temelidir — yerel fiyat uçlarını (salınım yüksekleri ve düşükleri) tanımlarlar.
SmartFractalZigZag, ayarlanabilir hassasiyete sahip geçmişe dayanıklı bir fraktal motoru kullanır, böylece tespiti scalping, intraday, salınım veya pozisyon ticaretine uyarlayabilirsiniz. Sol Çubuklar ve Sağ Çubuklar parametreleri, genel strateji mantığınızı değiştirmeden motoru daha seçici veya daha az seçici yapmanızı sağlar.
Ticaret tarzına göre önerilen ayarlar:
• Scalping: Sol 3 / Sağ 2
• Intraday: Sol 5 / Sağ 3
• Salınım: Sol 10 / Sağ 5
• Pozisyon: Sol 20 / Sağ 10
────────────────────────────────────────────────────────────────────────────────
2. AKILLI AYNI YÖN FİLTRELEME
Birden fazla ardışık fraktal aynı yönde göründüğünde, gösterge sadece gerçek ucu (yukarı fraktallar için en yüksek yüksek, aşağı fraktallar için en düşük düşük) tutar.
Bu, temiz bir Yüksek–Düşük–Yüksek–Düşük dizisi sağlar ve yapıyı okumayı kolaylaştırır. Sadece en son, en sağdaki fraktal yeni çubuklar kapandıkça ayarlanabilir; geçmiş yapı yeniden boyanmaz.
────────────────────────────────────────────────────────────────────────────────
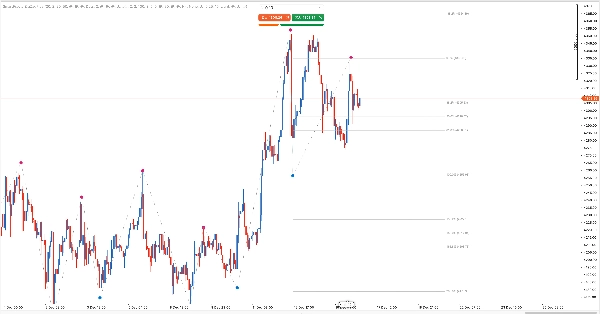
3. ZIGZAG SALINIMLARI
Filtrelenmiş fraktal noktalar ZigZag salınımlarına bağlanır, trend yönünü ve salınım sınırlarını bir bakışta net şekilde gösterir.
────────────────────────────────────────────────────────────────────────────────
4. GERÇEK ZAMANLI OTOMATİK FİBONACCİ
En son salınıma dayalı olarak otomatik Fibonacci geri çekilme ve uzatma seviyeleri çizer:
• Otomatik çapa noktaları – her zaman onaylanmış yapısal yüksek/düşüklerle bağlantılı
• Dinamik güncellemeler – yeni yapı oluşurken seviyeler gerçek zamanlı ayarlanır
• Yaygın kullanılan geri çekilme ve uzatma seviyelerinin tam seti (trend devamı için negatif uzantılar dahil), hepsi ayrı ayrı yapılandırılabilir
• Temiz görsel kural: Bir Fib seviyesi fiyatı Plus S/R bölgesi içine düştüğünde, Fib etiketi ekstra şekiller çizmek yerine [SR] öneki ile kalınlaştırılır. Bu, grafiği karıştırmadan "güçlü S/R bölgesi içinde Fibonacci"yi kolayca fark etmeyi sağlar ve Pro sürümüne göre önemli bir yükseltmedir.
────────────────────────────────────────────────────────────────────────────────
5. TEMA DESTEĞİ
Grafik arka planıyla otomatik eşleşen yerleşik açık/koyu tema desteği. Tüm çizgiler, bölgeler ve etiketler her iki tema için okunabilirlik açısından ayarlanmıştır.
════════════════════════════════════════════════════════════════════════════════
SADECE PLUS İÇİN S/R VE UYUM MOTORU
────────────────────────────────────────────────────────────────────────────────
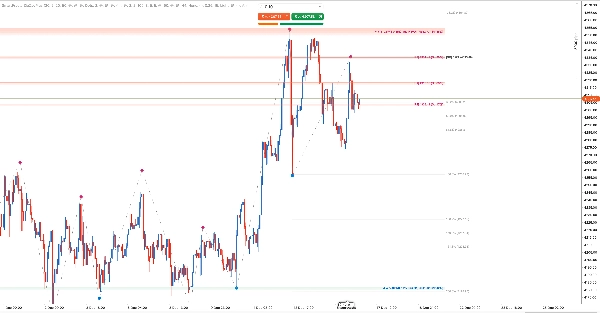
6. DİNAMİK S/R BÖLGELERİ (KDE Yoğunluk Isı Haritası)
Plus, fraktal yapısının üzerine tam dinamik bir Destek/Direnç bölgesi motoru ekler:
• Fraktal tabanlı S/R dönüm noktaları – bölgeler, ana gösterim fraktallarından bağımsız, ancak aynı geçmişe dayanıklı kuralları takip eden özel S/R fraktallarından oluşturulur
• Fraktal sayısına göre sabit pencere – tek bir Fraktal Pencere Boyutu parametresi (örneğin 100) yapılandırırsınız. Motor her zaman en son N S/R fraktalını kullanır, kaç çubuk kapsadıklarına bakılmaksızın
• Zaman ağırlıklı ve salınım ağırlıklı yoğunluk – her S/R fraktalı, yenilik, salınım büyüklüğü ve fiyat konumuna göre çekirdek yoğunluk tahminine katkıda bulunur
• Otomatik bant genişliği (ek girdi yok) – bölge genişliği fraktal aralığı ve ATR'den türetilir, sağlam bir aralığa sıkıştırılır
• Isı haritası görselleştirmesi – bölgeler yoğunluğa dayalı opaklıkla çok katmanlı dikdörtgenler olarak çizilir, böylece güçlü bölgeler görsel olarak daha kalın ve parlak görünür
• Taraf başına Maks Bölgeler – Maks Direnç Bölgeleri ve Maks Destek Bölgeleri, gösterilen bölge sayısını sınırlar, güç sıralaması doğal filtre olarak kullanılır
BU S/R MOTORU GELENEKSEL SEVİYELERDEN NASIL FARKLIDIR
Çoğu destek/direnç aracı ya birkaç manuel yatay çizgi çizer ya da fiyatın basit bir fiyat seviyesine kaç kez dokunduğunu sayar.
Plus çok farklı, kantitatif bir yaklaşım benimser:
• Fraktal çapa noktalarına bağlı, keyfi değil – her bölge tek çubuk fitillerinden ziyade yapısal olarak geçerli fraktal dönüm noktalarından türetilir
• Bölgeler, ince çizgiler değil – KDE, ticaretin gerçekten yoğunlaştığı yerleri yansıtan tam fiyat bantları oluşturur, tek bir kesin tik yerine
• Güç olasılık benzeri, ham dokunuş sayısı değil – her tepki bant yüksekliği ve ATR ile normalize edilir, sonra zaman içinde EffectiveStrength olarak birleştirilir
• Yaşam döngüsüne duyarlı – hızlı taramalar, temiz kırılmalar ve tekrarlanan, aralıklı yeniden testler çok farklı şekilde ele alınır; "kırılmış ve göz ardı edilmiş" bir seviye doğal olarak güç kaybeder
• Tarihte stabil – bir bölge oluşturulup onaylandıktan sonra konumu stabildir; sadece yeni tepkiler ve HTF kanıtları gücünü güncelleyebilir (geçmiş tepkilerin tarihi yeniden boyanması yoktur)
Sonuç, kurumsal olarak kullanılan arz/talep bölgelerinin davranışına çok daha yakın bir S/R haritasıdır, klasik "çizgi çiz ve dokunuşları say" göstergelerinden ziyade.
────────────────────────────────────────────────────────────────────────────────
7. TEPKİYE DUYARLI BÖLGE YAŞAM DÖNGÜSÜ
Bir seviyeye yapılan tüm dokunuşlar eşit değildir. Plus her S/R bölgesinin yaşam döngüsünü modeller:
• Durumlar – Aktif, Testte ve Kırılmış
• Test türleri – motor, bant dışına birkaç kapanışla temiz kırılmaları, hızlıca içeri dönen güçlü dönüşle kısa süreli taramaları ve kırılmayan yeniden testleri (dokunuş/içeride ve dokunmadan yaklaşım reddi) ayırt eder
• Tepki Skoru – her test penceresinde fiyat hareketi bant yüksekliği ve ATR'ye göre normalize edilip Tepki Skoru ∈ [-1, 1] (pencere içinde son ağırlıklı) olarak dönüştürülür
• Test Skoru – tekrarlanan, iyi aralıklı başarılı testler ayrı bir Test Skoru boyutunu artırır
• Etkin Güç – Tepki Skoru ve Test Skoru, temel yapısal güçle logit alanında birleştirilerek her bölge için stabil Etkin Güç elde edilir
Sonuç, "Bu seviye geçmişte ne kadar iyi dayandı?" sorusuna cevap verebilen, sadece "Fiyat kaç kez dokundu?" sorusuna değil bir bölge motorudur.
────────────────────────────────────────────────────────────────────────────────
8. ÇOKLU ZAMAN DİLİMİ S/R UYUMU
Plus, daha yüksek zaman dilimlerinde (HTF) S/R bölgelerini otomatik hesaplar ve etkilerini mevcut grafiğe yansıtır:
• 3'e kadar HTF seçimi – M30, H1, H4, D1, W1, MN1'in herhangi bir kombinasyonunu etkileşimli panel düğmeleriyle seçin
• HTF seçim kalıcılığı – seçimleriniz aynı grafik penceresinde zaman dilimi değişikliklerinde kalır
• Yapılandırılabilir Birincil/İkincil/Üçüncül HTF'ler (veya mevcut zaman dilimine göre otomatik eşleme)
• Standart ve standart dışı TF'lerle (M2, H2 vb.) çalışan sağlam zaman dilimi sıralaması
• Hem mevcut hem HTF bant genişliklerine dayalı uyarlanabilir örtüşme toleransı
• Bölge başına HTF uyum meta verisi saklanır: HtfTag (ör. H4, H4+D1) ve ConfluenceTFCount
• Üçgen öneki – HTF uyumu olan bölgelerde, etiket metni 1 ila 3 üçgen (▲/▼) ile başlar, kaç HTF'nin uyumda olduğunu gösterir, ayrıca düzeltilmiş güç etiketi
Örnek: ▲▲ Corr Str 82% [S5 H4+D1] (Str:76%)
Burada Corr Str 82% HTF ile düzeltilmiş güç, Str:76% ise ham mevcut zaman dilimi Etkin Güç'tür.
────────────────────────────────────────────────────────────────────────────────
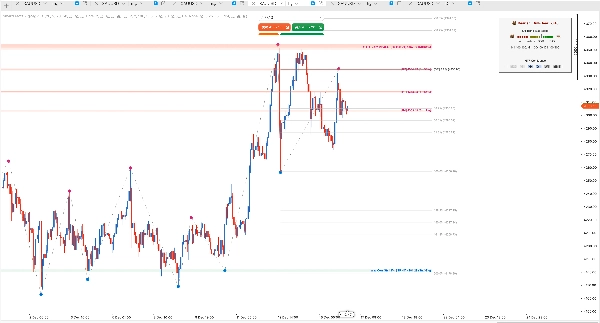
9. SR TREND EĞİLİMİ (Boğa/Ayı Endeksi) PANELİ
Kompakt bir SR Trend Eğilimi paneli, mevcut fiyat etrafındaki net destek ve direnç gücünü özetler:
• Küçült/genişlet düğmesi – paneli gerekmediğinde daraltın; durum oturumlar arasında kalır
• HTF sıfırlama düğmesi – HTF seçimlerini mevcut zaman dilimine göre otomatik eşleme varsayılanlarına geri yükler
• Yakındaki bölgelerin Etkin Gücü ağırlık olarak kullanılır
• [-1, 1] aralığında bir eğilim endeksi verir, Dengeli, Hafif Boğa, Boğa, Güçlü Boğa, Güçlü Ayı gibi sezgisel etiketlere eşlenir
• Ayı/boğa simgeleri ve hızlı okuma için renk kodlu segmentlerle görsel ölçek
• Veri yetersiz olduğunda net şekilde belirtir (örneğin yeterli S/R fraktalı yok veya etkili bölge katkısı yok)
• Sadece destek veya sadece direnç etkili olarak mevcutsa, endeks yine hesaplanır (doğal olarak +1 veya -1'e yaklaşır)
────────────────────────────────────────────────────────────────────────────────
10. OTOMATİK GEÇMİŞ DOLDURMA & STABİLİTE
S/R bölgeleri ve HTF uyumunun anlamlı olması için gösterge otomatik olarak geçmiş yüklemeyi yönetir:
• Mevcut/HTF fraktal sayısı Fraktal Pencere Boyutunun altındaysa ek geçmiş talep eder
• Sembol/zaman dilimi başına yükleme durumunu izler, platform aşırı yüklenmesini önlemek için sınırlama ve geri çekilme uygular
• HistoryLoaded/Reloaded olaylarını işler ve çubuklar kaydığında dahili durumu tamamen yeniden oluşturur
• SR Eğilim panelini her zaman gerçek veri kullanılabilirliği ile senkron tutar
────────────────────────────────────────────────────────────────────────────────
11. MOTORUN İÇİ: KANTİTATİF MOTOR
Plus'ın S/R motoru, görsel çıktısının semboller, zaman dilimleri ve yakınlaştırma seviyeleri arasında tutarlı kalması için kasıtlı olarak matematiksel olarak yoğundur:
• Fraktal dönüm noktaları üzerinde Çekirdek Yoğunluk Tahmini (KDE), ATR-normalize bant genişliği ile, keyfi fiyat seviyeleri yerine gerçek arz/talep kümelerini bulmak için
• Str% için sabit normalizasyon tabanı, böylece "güçlü" bir bölge yakınlaştırılmış veya uzaklaştırılmış olmasına bakılmaksızın aynı anlama gelir
• Logit alanı kanıt füzyonu – Temel Güç, Tepki Skoru, Test Skoru ve HTF kanıtları lojistik dönüşümlerle birleştirilir, rastgele puanlar değil. Bu, güç ölçeğinin düzgün ve sınırlı kalmasını sağlar
• Üssel zaman azalması ve aralık kontrolleri – eski tepkiler ve sıkışık testler yarı ömür tarzı formüllerle otomatik olarak ağırlık azaltılır
• Stabil geçmiş tasarımı – bir salınım veya bölge onaylandıktan sonra konumu ve Str% stabildir; sadece en yeni kanıt düzeltilmiş gücü etkileyebilir
════════════════════════════════════════════════════════════════════════════════
KİMLER İÇİN?
• Temiz, tarihsel olarak tutarlı yapı ve dinamik S/R ısı haritaları isteyen intraday ve salınım traderları
• OTE bölgeleri ve çevresindeki S/R'nin güçlü veya zayıf tepki geçmişine önem veren SMC/ICT traderları
• Tek ekranda otomatik Fibonacci ve S/R bağlamı isteyen takdirli traderlar
• Daha yüksek zaman dilimi seviyelerine bağlı ve bunların aktif grafikte net işaretlenmesini isteyen çok zaman dilimli traderlar
════════════════════════════════════════════════════════════════════════════════
NEDEN SMARTFRACTALZIGZAG PLUS?
Sorun: Yatay çizgiler keyfi ve öznel hissediliyor
Çözüm: Bölgeler, net kurallara sahip katı bir fraktal + KDE yoğunluk algoritmasından üretilir
Sorun: Bir seviyenin güçlü mü zayıf mı olduğu anlaşılamıyor
Çözüm: Tepkiye duyarlı yaşam döngüsü ve Etkin Güç, hem yapısal önemi hem de fiyatın seviye etrafındaki davranışını nicelendirir
Sorun: HTF seviyelerini akılda tutmak zor
Çözüm: Otomatik HTF S/R uyumu ve her bölge etiketinde net HtfTag + üçgen öneki
Sorun: Çok sayıda ayrı araç grafik karıştırıyor
Çözüm: Bir gösterge fraktallar + ZigZag + Fibonacci + dinamik S/R + HTF uyumu + Eğilim panelini birleştirir
Sorun: Geçmiş doldurma davranışı öngörülemez
Çözüm: Veri hala indiriliyorsa veya tükenmişse kullanıcı arayüzü geri bildirimi ile açık geçmiş yükleme yönetimi
════════════════════════════════════════════════════════════════════════════════
HERHANGİ BİR METODOLOJİ İLE ÇALIŞIR
• SMC / ICT – BOS, CHoCH, salınım noktaları, OTE bölgeleri, tepkiye duyarlı S/R ve likidite taramaları
• Elliott Dalga – Salınım dönüm noktaları, Fibonacci uzantıları ve dinamik S/R bölgeleri ile uyum
• Dow Teorisi – Görsel olarak net ZigZag salınımları ile daha yüksek yüksekler / daha düşük düşükler
• Wyckoff – Arz/talep bölgeleri, yaylar, yükselişler ve tepki kaliteleri
• Chan Teorisi – Kalemler, segmentler ve yapısal dönüm noktası hizalaması
• Fibonacci – Otomatik çizilen seviyeler ve bölge farkındalıklı [SR] uyum etiketleri
════════════════════════════════════════════════════════════════════════════════
PARAMETRELER (Plus Öne Çıkanlar)
Aşağıda en önemli parametre gruplarının üst düzey bir genel bakışı bulunmaktadır. Tam teknik detaylar için lütfen eşlik eden dokümantasyona bakınız.
────────────────────────────────────────────────────────────────────────────────
1. Fraktal Ayarları
• Sol Çubuklar – Karşılaştırma için soldaki çubuklar (varsayılan: 20)
• Sağ Çubuklar – Onay için sağdaki çubuklar (varsayılan: 2)
Fraktal Görüntüleme:
• Yukarı Fraktal Rengi – varsayılan: DeepPink
• Aşağı Fraktal Rengi – varsayılan: DodgerBlue
• Fraktal Boyutu – varsayılan: 20
• Fraktal Ofseti (Puan) – varsayılan: 50
• Fraktalları Göster – varsayılan: AÇIK
Filtre Ayarları:
• Ardışık Filtreleme – ZigZag & Fibonacci için gerekli olan akıllı aynı yön filtreleme (varsayılan: AÇIK)
────────────────────────────────────────────────────────────────────────────────
2. ZigZag Ayarları
• ZigZag'ı Etkinleştir – varsayılan: AÇIK
• ZigZag Rengi – varsayılan: Gri
• ZigZag Stili – varsayılan: Noktalar
• ZigZag Kalınlığı – varsayılan: 2
────────────────────────────────────────────────────────────────────────────────
3. Fibonacci Ayarları
• Fibonacci'yi Etkinleştir – Ana anahtar (varsayılan: AÇIK)
• Etiketleri Göster – Fiyat etiketlerini göster (varsayılan: AÇIK)
• Seviye anahtarları – -100%'den 200%'ye kadar 19 ayrı seviye anahtarı (Çekirdek seviyeler varsayılan olarak AÇIK)
Not: RightOffset, mevcut görünür grafik genişliğinin (görünüm alanı) yüzdesi olarak yorumlanır ve güvenli bir aralığa (1%-500%) sıkıştırılır. Fib çizgileri/etiketleri ve S/R bölgeleri/etiketlerinin paylaşılan sağ kenarını kontrol eder.
────────────────────────────────────────────────────────────────────────────────
4. S/R Bölgesi Ayarları (Plus)
• S/R Bölgelerini Etkinleştir – Dinamik S/R motoru için ana anahtar (varsayılan: AÇIK)
• Bölge Dönüm Noktası Sol Çubuklar – varsayılan: 2
• Bölge Dönüm Noktası Sağ Çubuklar – varsayılan: 2
• Fraktal Pencere Boyutu – Kullanılan son S/R fraktal sayısı (varsayılan: 100)
• Mesafe Ölçeği (ATR x) – varsayılan: 5.0
• Maks Direnç Bölgeleri – varsayılan: 5
• Maks Destek Bölgeleri – varsayılan: 5
• Bölge Etiketlerini Göster – varsayılan: AÇIK
• Maks Opaklık % – varsayılan: 90
• Direnç Rengi – varsayılan: Tomato
• Destek Rengi – varsayılan: MediumSeaGreen
────────────────────────────────────────────────────────────────────────────────
5. HTF S/R Uyumu
• HTF Uyumunu Kullan – Çoklu TF S/R uyumunu etkinleştir (varsayılan: AÇIK)
• Otomatik HTF Eşleme – Mevcut TF'ye göre HTF'yi otomatik seç (varsayılan: AÇIK)
• Birincil HTF – varsayılan: H4
• İkincil HTF – varsayılan: Yok
• Üçüncül HTF – varsayılan: Yok
────────────────────────────────────────────────────────────────────────────────
6. SR Trend Eğilimi (Boğa/Ayı Endeksi)
• SR Trend Eğilimini Etkinleştir – varsayılan: AÇIK
• Trend Eğilimi Eşiği – Dengeli ile Boğa/Ayı arasındaki eğilim eşiği (varsayılan: 0.25)
────────────────────────────────────────────────────────────────────────────────
7. Görüntüleme & Tema Ayarları
• Sağ Ofset (%) – Görünür grafik genişliğinin sağda ayrılan yüzdesi (varsayılan: 30)
• Renk Teması – Açık / Koyu (varsayılan: Açık)
• Tema Paletini Kullan – varsayılan: AÇIK
────────────────────────────────────────────────────────────────────────────────
8. Diğer Ayarlar
• Tüm Örnekleri Temizlemeye Zorla – varsayılan: KAPALI
• Hata Ayıklama Geçmiş Yüklemesi – varsayılan: KAPALI
════════════════════════════════════════════════════════════════════════════════
YÜKSELTME YOLU
Şu anda SmartFractalZigZag Pro kullanıyorsanız ve istiyorsanız:
• KDE yoğunluk ısı haritaları ile dinamik, tepkiye duyarlı S/R bölgeleri
• Otomatik çok zaman dilimli S/R uyumu ve net görsel üçgenler
• Gerçek S/R gücünden oluşturulmuş entegre bir Boğa/Ayı Trend Eğilimi paneli
o zaman SmartFractalZigZag Plus doğal yükseltmedir — aynı temel motoru tam yapı + matematik + dinamik S/R + HTF uyumu iş akışına genişletir.
════════════════════════════════════════════════════════════════════════════════
ÖNEMLİ NOTLAR
TASARIMLA STABİL GEÇMİŞ
Gösterge, onaylanmış salınımları ve S/R bölgelerini geçmişte stabil tutacak şekilde inşa edilmiştir, ancak aktif bacak/bölgenin yeni fiyat hareketine tepki vermesine izin verir. Bir yapı onaylandığında, çapa noktaları kilitlenir; sadece hala oluşan bacak ve en yeni bölge piyasa geliştikçe uyum sağlar.
ANAHTAR BAĞIMLILIKLAR
ZigZag ve Fibonacci her ikisi de Ardışık Filtreleme = AÇIK olmasını gerektirir. Bunu kapatırsanız, sadece ham fraktal noktaları gösterilir ve ZigZag/Fibonacci devre dışı kalır. S/R bölgeleri her zaman kendi özel fraktal motorunu kullanır ve aynı yön filtrelemesi zorunludur.
VERİ YETERLİLİĞİ
S/R bölgeleri ve HTF uyumu, mevcut ve seçili HTF zaman dilimlerinde en az Fraktal Pencere Boyutu S/R fraktalı gerektirir. Veri hala yükleniyorsa veya yetersizse, Eğilim paneli bu durumu net şekilde belirtir.
DENEME
Bir deneme süresi cTrader Store üzerinden mevcut olabilir, böylece satın almadan önce göstergenin kendi sembolleriniz ve zaman dilimleriniz üzerinde test edebilirsiniz.
════════════════════════════════════════════════════════════════════════════════
DESTEK
Herhangi bir sorunuz veya geri bildiriminiz varsa, lütfen cTrader Store üzerinden bizimle iletişime geçin.
SmartFractalZigZag Plus'ı seçtiğiniz için teşekkür ederiz!