present
Kaydolun ve ilk alışverişinizde $50 indirim kazanın
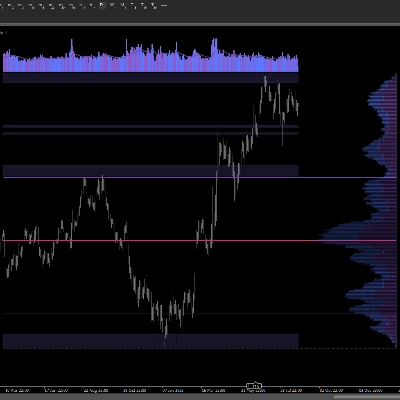
Trading product for DRXFootprint Gösterge Aggressive BOS, image 1
DRXFootprint
Gösterge
1 satın almalar
Sürüm 1.0, Jul 2026
Windows, Mac
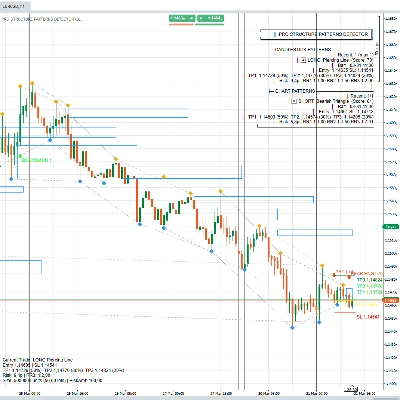
Trading product for DRXFootprint Gösterge Aggressive BOS, image 2
Trading product for DRXFootprint Gösterge Aggressive BOS, image 3
Trading product for DRXFootprint Gösterge Aggressive BOS, image 4
Başlangıç 08/07/2026

Açıklama

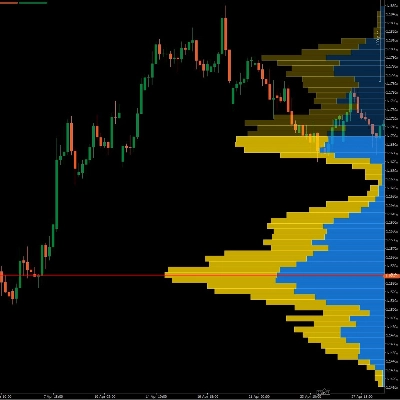
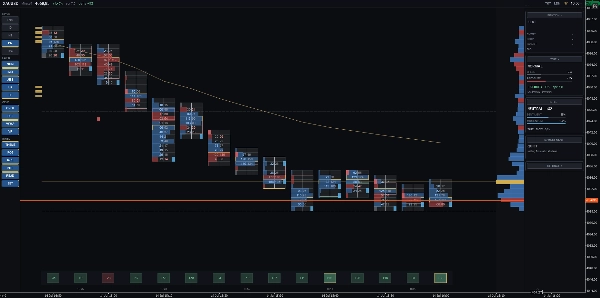
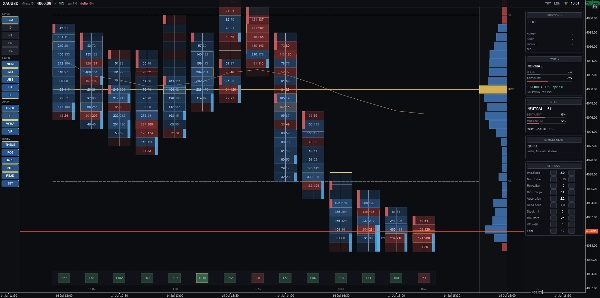
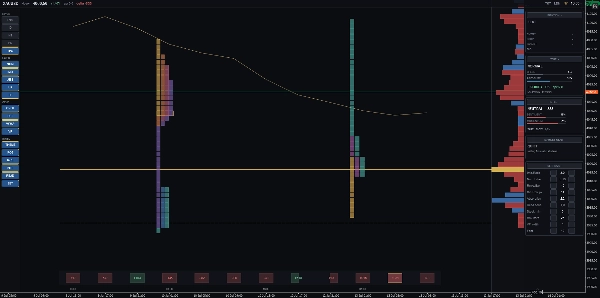
DRX OrderFlux, tik verilerini temiz bir emir akışı grafiğine dönüştürür, momentumun nerede durduğunu ve müzayedenin hangi seviyeleri tekrar tekrar test ettiğini gösterir. ÇİZDİĞİ ŞEYLER - Teklif x Talep ayak izi: Alım ve satım faaliyetlerinin yan yana olduğu fiyat seviyelerine ayrılmıştır. Beş görünüm: Teklif x Talep, Delta, Isı Haritası, Profil ve TPO. - Dengesizlikler ve yığılmış duvarlar: Hacim dengesizliğinin seçtiğiniz oranı aştığı fiyat seviyelerini vurgular. - Emilim ve tamamlanmamış müzayedeler: Fiyatı daha ileri itemeyen yüksek faaliyetleri ve tamamlanmamış kapanan aşırı seviyeleri tespit eder. - Tekli baskılar: Hızlı reddedilmeden önce kısa süre ziyaret edilen fiyat seviyelerini vurgular. - Hacim profili: POC, VAH, VAL ve oturum VWAP ile sağ kenara sabitlenmiş bir panelde gösterilir. - TPO zaman blokları: Her oturum için bir profil, özel POC ile, kronolojik olarak renk kodlu. - Delta şeridi: Doğrudan karşılaştırma için alt kısımda tek hizalamada konumlandırılmıştır. - Piyasa okuması: Net reddedilmeler veya hacim patlamaları sırasında beliren göze çarpmayan sinyaller. Eşikler sembol başına otomatik olarak kendi kendini kalibre eder. - Bant paneli: Mevcut bant hızını ortalama seviyelere karşı ölçer ve likidite uyarıları sağlar. - Pozisyon paneli: Giriş, durdurma, hedef, Kar/Zarar ve Risk-Ödül oranını net grafik çizgileriyle gösterir. Düzen ayarları sembol ve zaman dilimi başına otomatik olarak kaydedilir. NASIL KULLANILIR Tüm semboller ve zaman dilimleri ile uyumludur. Gün içi analiz için idealdir (M1'den H1'e). Özel hacim, delta ve kümülatif delta panelleri için DRX Footprint Lower ile birlikte çalışır. VERİ HAKKINDA cTrader tik verileri zaman, teklif ve talep fiyatlarını içerir, ancak işlem büyüklüğü verisi iletmez. DRX OrderFlux, standart FX tik hacmi metodolojisini takip ederek işlem gören sözleşme hacmi yerine tik faaliyetini ölçer. Piyasa Derinliği verileri broker beslemelerine dayanır. Çoğu CFD hesabı sınırlı toplanmış seviyeler sağlar; bu nedenle likidite uyarıları emir defteri merdiveni yerine bant paneline entegre edilmiştir.

Özet

YZ özeti
DRXFootprint is an order flow indicator designed for use on any symbol and timeframe, with optimal performance on intraday charts (M1 to H1) for instruments like gold, indices, oil, and major forex pairs. It transforms tick data into a detailed order flow chart, displaying bid and ask activity side by side at each price level within bars, effectively breaking down each bar into its constituent buy and sell actions.

Key features include five distinct views: Bid x Ask footprint, Delta, Heatmap, Volume Profile, and TPO (Time Price Opportunity). The indicator highlights imbalances and stacked walls where one side dominates, absorption zones where heavy activity fails to move price, unfinished auctions, and single prints—levels touched only once. The volume profile panel shows POC (Point of Control), VAH (Value Area High), VAL (Value Area Low), and session VWAP. TPO profiles per session are color-coded to compare auction shapes across days.

Additional tools include a delta lane for comparing bars, a market read panel that signals price rejections or breaks with volume and delta confirmation, a tape panel showing tape speed and liquidity warnings, and a position panel displaying entry, stop, target, PnL, pips, and risk-reward ratio. Layouts are saved per symbol and timeframe for consistent workspace setup.

DRXFootprint uses cTrader tick data, measuring tick activity rather than traded contract volume, and includes liquidity warnings based on broker depth of market data.
Gösterge profili

Tartışma

Müşteri değerlendirmeleri

0.0
Değerlendirmeler: 0
Müşteri değerlendirmeleri
Bu ürün için henüz bir değerlendirme yok. Ürünü denediniz mi? O zaman ona dair görüşlerini paylaşan ilk kişi olun!

SSS

Aggressive
BOS
Imbalance
Order Block
Volume
CHOCH
DOM Tools
cTrader Store üzerinden erişilebilen işlem botları, göstergeler ve eklentiler gibi ürünler, üçüncü taraf sağlayıcılar tarafından sağlanır ve yalnızca bilgilendirme ve teknik erişim amaçlarıyla sunulur. cTrader Store bir broker değildir ve yatırım tavsiyesi, kişisel öneriler vermez veya gelecekteki performansı garanti etmez.

Şunları da beğenebilirsiniz

Gösterge
SMC
Prop
+14
Right-anchored cTrader Volume Profile with VAH/VAL/POC, LVZ, top volume+EMA, themes, and fast, readable visuals.
Gösterge
Forex
Signal
+4
Pro Structure & Candlestick Patterns Detector
Gösterge
RSI
Forex
+7
Advanced S/R + liquidity zone detector with auto-configured trade styles. Generates filtered entry signals with TP/SL.
Gösterge
ATR
Signal
One of the best indicators we have ever developed, with a very high profit ratio.
Gösterge
Risk Dashboard
AI-powered daily range forecasts help traders spot volatility opportunities and plan stops and targets.
Gösterge
SMA
Volume
+3
Stoc​h PRO Quad Rotation Signal (QRS) is an advanced technical analysis indicator developed for cTrader.
Gösterge
Key Levels
Liquidity Grab
+2
The levels you mark each morning, drawn and followed: PDH/PDL, weekly, monthly, sessions, equal highs/lows.
Gösterge
Doji
Wedge
+5
Angora Pattern Recognition is a cTrader indicator that finds, draws and tracks classic chart patterns automatically.
Gösterge
Smart Signal Reversal Trend + Patterns
Gösterge
AI
ATR
+5
🦅 AI Institutional System: Order Blocks, Volume Delta Profile, OrderFlow Limit Buy/Sell, MTF, psychology & reversal.
Gösterge
Prop
Forex
+5
Half Trend – Trend Reversal Indicator for cTrader
Gösterge
Signal
Indices
The **Whale Hunting Indicator** is a trading tool for **Boom & Crash and Volatility indices**, featuring **Auto Trend De
Gösterge
AI
SMC
+19
Fixed Range Volume Profile - TradingView Style (POC, VAH, VAL)
Gösterge
Volume
Key Levels
Dynamic Visible Range Volume Profile for cTrader. Real-time POC, Value Area & Smart Alerts for precise trading.
Gösterge
Fibonacci
Key Levels
+1
Explore Elliott wave counts, three swing sizes and example levels with an interactive cTrader chart panel.
Gösterge
BOS
Fibonacci
+4
Market structure, liquidity sweeps, BOS/CHoCH, smart zones and BUY/SELL setups with Entry, SL and TP.
Gösterge
Order Block
Supply & Demand
+2
Professional MTF dashboard aggregating and clustering Supply & Demand zones from multiple timeframes in cTrader.
Gösterge
ATR
SMC
+18
Precision SMC tool with HTF sweeps, MSS confirmation & smart FVG detection for high-probability reversals.

Fiyat

Başlangıç 08/07/2026