present
Regístrese y obtenga 50 $ de descuento en su primera compra
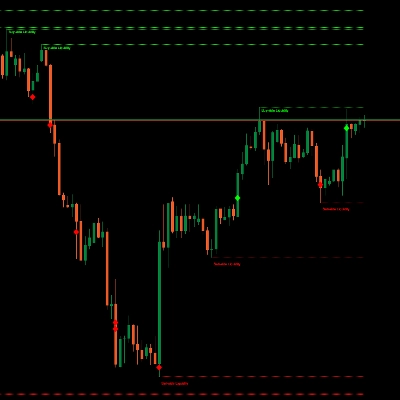
Trading product for Smart Elliott Waves Indicador Fibonacci Key Levels, image 1
Smart Elliott Waves
Indicador
Versión 1.1, Oct 2026
Windows, Mac
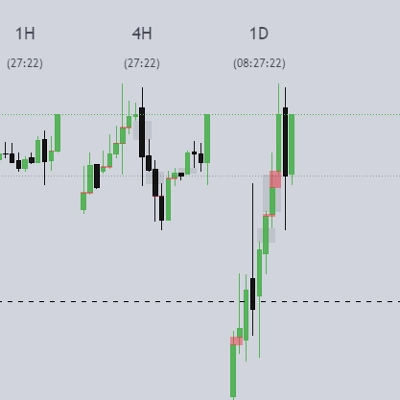
Trading product for Smart Elliott Waves Indicador Fibonacci Key Levels, image 2
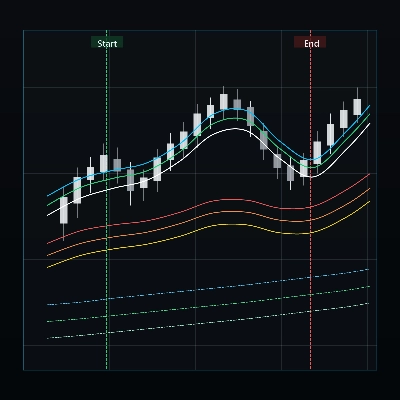
Trading product for Smart Elliott Waves Indicador Fibonacci Key Levels, image 3
Trading product for Smart Elliott Waves Indicador Fibonacci Key Levels, image 4
Desde 16/10/2026

Descripción

Smart Elliott Waves


Smart Elliott Waves is a chart-pattern indicator for cTrader Windows. It helps you examine possible Elliott wave counts, compare swing sizes and review reference levels in the context of real price history. It supports manual analysis; it does not open or manage trades.


READ THE STRUCTURE

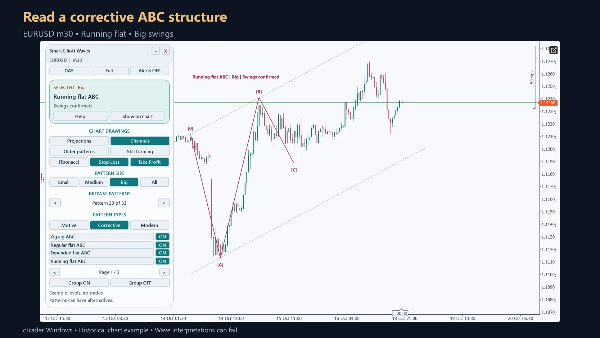
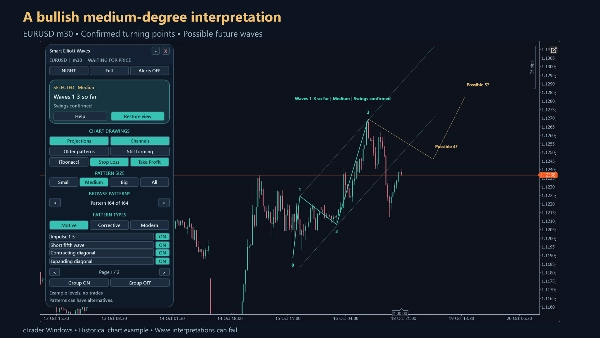
Explore 22 pattern families across Motive, Corrective and Modern groups. Small, Medium and Big use different swing depths; All shows the combined selection. Browse alternative counts and distinguish confirmed swing points from a last swing that is still forming. Confirmation of the swing points does not guarantee that a wave interpretation will succeed.


CONTROL THE CHART

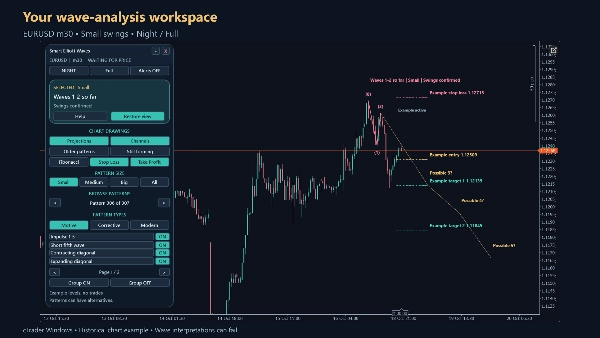
Use the draggable panel to show or hide projections, channels, Fibonacci retracements and older patterns. Filter individual pattern families or a whole group. Choose Day or Night colours and Full, Standard or Compact layouts. The panel adapts to available chart space, remembers settings when enabled, and includes 21 help pages.


REVIEW EXAMPLE LEVELS

Eligible confirmed patterns may display a hypothetical entry, stop and two targets. The indicator records target, stop, expiry and ambiguous touch states. These are analytical examples based on candle data, not broker executions or profit records. If a stop and target are touched within one candle, their sequence cannot be determined from that candle alone.


PRACTICAL USE

Start on a liquid forex instrument with a readable candle history, for example EURUSD h1. Compare Small, Medium and Big, then browse counts to understand alternative interpretations. Use historical examples to learn the controls before relying on any analysis. Data availability, instrument precision, history length and settings affect the result. No instrument or period is guaranteed to be profitable.


ALERTS AND OUTPUTS

Optional desktop popup and email alerts report newly confirmed patterns after initialization. Alerts are off by default. Email requires a working cTrader email configuration and sender/recipient settings. Eight outputs expose the latest analytical plan: direction, entry, stop, target 1, target 2, known time, setup ID and status. Automation mode provides calculation access without the visual panel; it does not execute orders.


IMPORTANT LIMITS

Elliott interpretations can overlap and disagree. A forming final swing can move. Confirmed counts become available only after later price information confirms the swing. Projected waves are scenarios, not forecasts. Modern patterns use explicit experimental shape rules. Smaller-wave evidence is bounded; it does not verify the count's position in a larger Elliott structure. A waiting or offline status is not a new market signal.


Trading involves risk. Past performance does not guarantee future results.


Resumen

Perfil del indicador
Categoría del indicador
Patrón
Tipo de resultado
Visualización
Señales
Requisitos de datos
Únicamente barras

Conversación

Valoraciones de clientes

0.0
Valoraciones: 0
Valoraciones de clientes
Este producto todavía no se ha valorado. ¿Ya lo ha probado? Sea el primero en informar a otros.

Preguntas frecuentes

Fibonacci
Key Levels
Market Structure
Los productos disponibles a través de cTrader Store, incluidos bots, indicadores y plugins para operar, son proporcionados por desarrolladores de terceros y están disponibles únicamente con fines informativos y de acceso técnico. cTrader Store no es un bróker, por lo que no proporciona asesoramiento de inversión, recomendaciones personales ni ninguna garantía de rentabilidad futura.

Más de este autor

Indicador
RSI
VWAP
+5
Trend direction, chart signals, reversal zones and volume tools in one configurable indicator.
Indicador
Volume
Order Block
+3
Map market structure, order blocks, liquidity and key zones with an interactive cTrader dashboard.
Indicador
Key Levels
Trend-filtered signals, transparent trade plans and a multi-timeframe decision panel for cTrader.
Indicador
Volume
Key Levels
+1
Six timeframe decisions, chart trade plans and historical risk simulation in one interactive cTrader indicator.
Indicador
Volume
Support & Resistance
Compare up to 27 symbols across eight timeframes with seven analysis engines and an interactive cTrader dashboard.
Indicador
ATR
Key Levels
+1
Explore 88 harmonic price-pattern variants with interactive chart controls and geometric reference levels.

Puede interesarle
Indicador
SMC
Prop
+13
Perfect for traders who demand a clear overview of multiple timeframes at a glance.
Indicador
AI
ATR
+27
Market Cipher B
Indicador
AI
Signal
+1
🔥 THIS BURNS JP225 INDICATOR – Professional Trading Signals
Indicador
ATR
BOS
+5
Market structure with BOS and CHoCH, order blocks, and retest buy/sell arrows with entry, stop and two targets
Indicador
VWAP
Support & Resistance
Trading.FC$_vwap Algo shows VWAP trends, dynamic support/resistance and deviation bands to spot potential trade entries.
Indicador
Forex
Crypto
+2
A powerful cTrader indicator with customizable Moving Average alerts, notifications, and automated trading actions.
Indicador
AI
SMC
+19
Fixed Range Volume Profile - TradingView Style (POC, VAH, VAL)
Indicador
Forex
BTCUSD
+5
Buy-Side & Sell-Side Liquidity (BSL/SSL) Indicator
Indicador
AI
SMC
+18
ICT HTF Candles- The Ultimate Multi-Timeframe Dashboard Stop switching timeframes and losing focus.
Indicador
Forex
BTCUSD
+5
Multi-timeframe moving averages with session lines for structured trend analysis directly on the chart.
Indicador
ATR
Key Levels
+1
Explore 88 harmonic price-pattern variants with interactive chart controls and geometric reference levels.
Indicador
Fair Value Gap
Liquidity Grab
+2
PRO Liquidity Sweep + FVG Combo detector with custom Gold/Blue signals & alerts
Indicador
BOS
MSS
+3
Advanced indicator to highlight key execution context and help aligning structure, location, and risk.
Indicador
Forex
Identify 34 candlestick patterns, track trends across timeframes, and get instant alerts with this powerful trading tool
Indicador
ATR
RSI
+5
One of the best indicators we have ever developed, with a very high profit ratio.
Indicador
Volume
Support & Resistance
Compare up to 27 symbols across eight timeframes with seven analysis engines and an interactive cTrader dashboard.
Indicador
Drawdown Monitor
Proprietary trading desk risk monitoring dashboard!
Indicador
RSI
Signal
+3
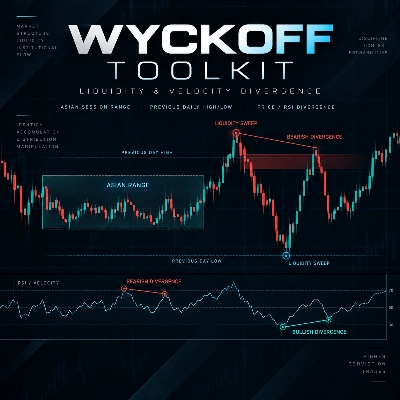
The Wyckoff Toolkit is the ultimate ally for traders seeking to decode the market through the lens of "smart money."

Precio

Desde 16/10/2026