
Açıklama
Donchian (Breakout) Stratejisi Kullanarak Nasıl İşlem Yapılır
- Satın Al fiyat N-periyotluk en yüksek seviyeyi (Üst) kırdığında.
- Sat fiyat N-periyotluk en düşük seviyeyi (Alt) kırdığında.
- Pozisyonu Tut trend devam ettiği sürece; zıt bir breakout veya trailing stop ile çıkış yap.
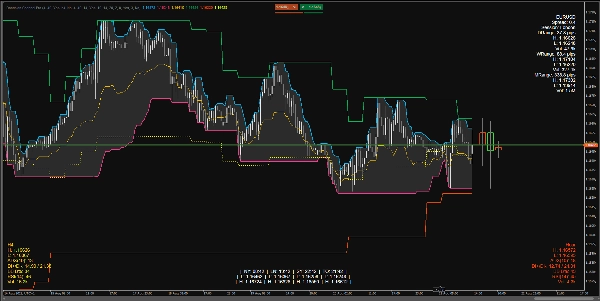
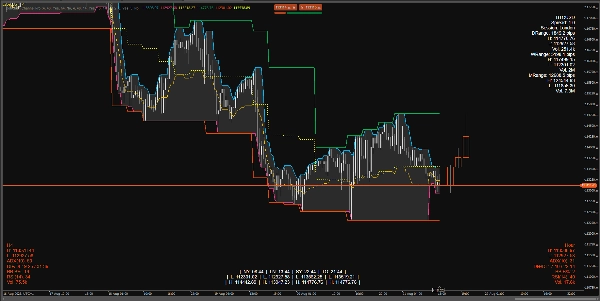
Gösterge Grafikte Ne Gösterir
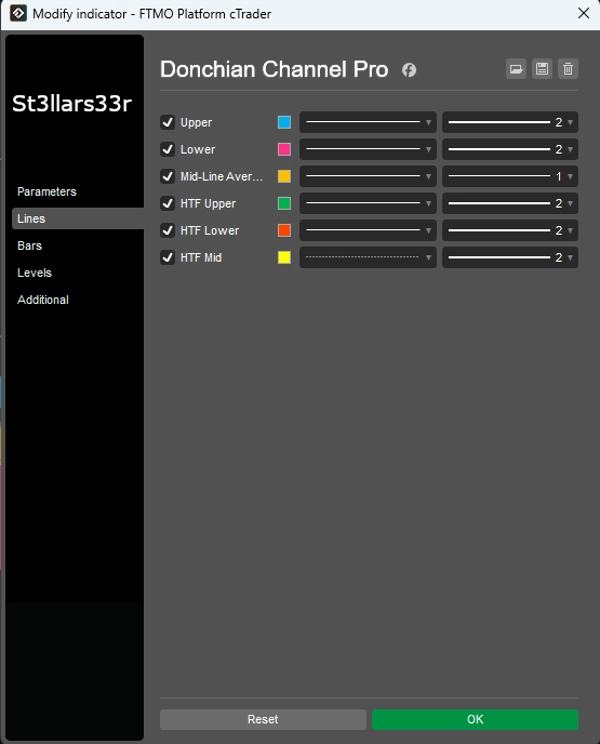
Mevcut Zaman Diliminde (TF) Donchian:
- Üst: Üst Kanal çubukları üzerindeki en yüksek fiyat.
- Alt: Alt Kanal çubukları üzerindeki en düşük fiyat.
- Orta: Üst ve Alt arasındaki orta nokta.
HTF Üst Üste Biniş: Daha yüksek zaman diliminden alınan Donchian çizgileri grafiğe bindirilmiş:
- HTF Üst, HTF Alt, HTF Orta
- HTF Mumlar HUD: Daha yüksek zaman dilimi mumlarını temsil eden dikdörtgenler, mevcut TF'deki son çubuğun sağ tarafına sabitlenmiş.
Alt/Üst HUD'lar (Heads-Up Displays):
- SağÜst: Sembol için bilgi paneli + günlük/haftalık/aylık aralıklar.
- SolAlt: HTF HUD (daha yüksek zaman dilimi metrikleri).
- SağAlt: Orta TF HUD (ara zaman dilimi metrikleri).
- AltOrta: Oturum saatleri + her oturum için Yüksek/Düşük (kalıcı).
Her HUD Ne Gösterir
SağÜst (Sağ Üst)
- SembolAdı
- Spread: Pip cinsinden spread.
- Oturum: Belirtilen saatlere göre aktif oturum.
- DGenişlik/HGenişlik/AGenişlik: Günlük/haftalık/aylık pip aralığı.
- Y/D/Hac: İlgili dönem için Yüksek/Düşük ve toplam hacim.
SolAlt (Sol Alt) — HTF HUD
- TF Adı (örneğin, H4, D1, vb.)
- Y/D: Son (veya aktif) HTF çubuğunun mevcut yüksek/düşüğü.
- ADX(n), DI+/DI-: Trend göstergeleri.
- BB B%: Mevcut fiyatın HTF Bollinger Bantlarına göre konumu (0 alt banda yakın, 100 üst banda yakın).
- RSI(n)
- Hac: HTF üzerindeki hacim.
- HUD Rengi:
-
- Yeşil: Aralık yukarı doğru genişliyor (DI+ ve ADX yükseliyor).
- Kırmızı: Aşağı yönlü baskı artıyor (DI- yükseliyor).
- Sarı: Nötr/tanımsız.
SağAlt (Sağ Alt) — Orta TF HUD
- HTF HUD ile aynı, ancak ara zaman dilimi (Orta Zaman Dilimi) için.
AltOrta (Alt Orta) — Saatler + Oturum Y/D
- Saat NY, LN, SY, TO'da.
- D/Y her oturum için.
- Kalıcı Mantık: Bir oturum aktif değilse, son tamamlanan oturumun Y/D'sini gösterir; yeni oturum başladığında değerler sıfırlanır ve yeniden hesaplanır.
Parametreler ve Kullanım Şekilleri
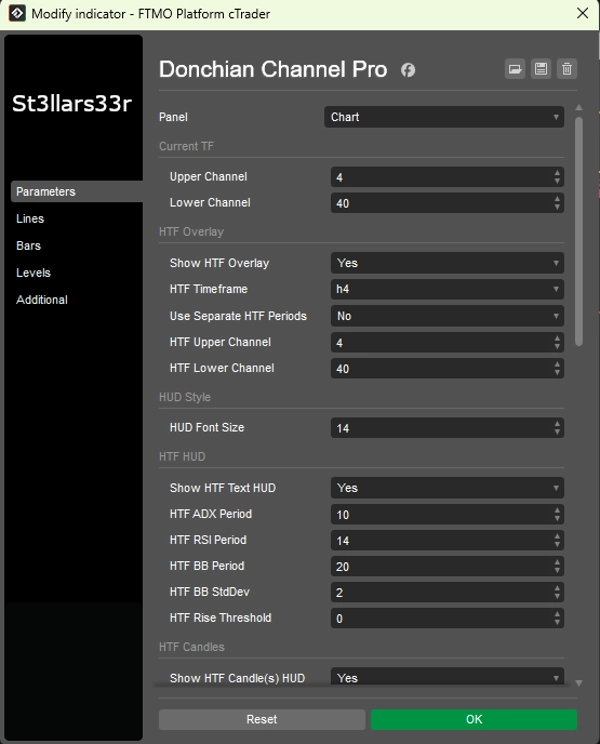
Grup: Mevcut TF (Mevcut Donchian)
- Üst Kanal: Üst kanal için çubuk sayısı. Daha büyük değer = daha az güncelleme, daha düz çizgi.
- Alt Kanal: Alt kanal için çubuk sayısı.
Grup: HTF Üst Üste Biniş (Yüksek Zaman Dilimi Donchian Üst Üste Binişi)
- HTF Üst Üste Binişi Göster: Grafikte HTF çizgilerini etkinleştirir.
- HTF Zaman Dilimi: Daha yüksek zaman dilimini seçin (örneğin, Saat4).
- Ayrı HTF Periyotları Kullan: Doğruysa, HTF Üst/Alt kendi parametrelerini kullanır; yanlışsa, mevcut Üst/Alt kullanılır.
- HTF Üst Kanal: HTF için üst kanal uzunluğu.
- HTF Alt Kanal: HTF için alt kanal uzunluğu.
Grup: HUD Stili
- HUD Yazı Tipi Boyutu: Tüm HUD'lar için yazı tipi boyutu (SağÜst, SolAlt, SağAlt, AltOrta).
Grup: HTF HUD (Sol Alt)
- HTF Metin HUD Göster: HTF için metin HUD'u göster.
- HTF ADX Periyodu: ADX/DI periyodu. Daha büyük = daha yumuşak, daha az gürültü, ancak daha yavaş tepki.
- HTF RSI Periyodu: RSI periyodu.
- HTF BB Periyodu: Bollinger Bantları periyodu.
- HTF BB StdSapma: BB için standart sapma çarpanı (klasik 2.0'dır).
- HTF Yükseliş Eşiği: Yükselen metriklere duyarlılık (HUD rengini etkiler).
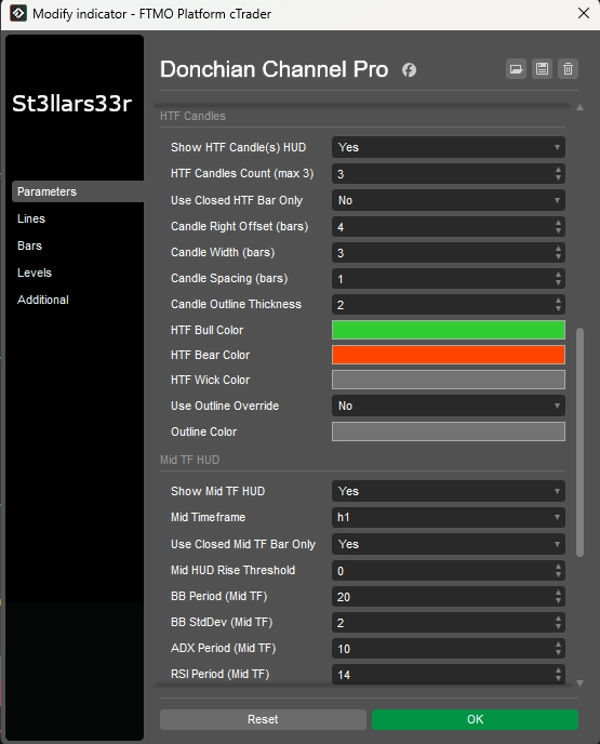
Grup: HTF Mumlar (Sağ, Son Çubuğa Yakın)
- HTF Mum(lar) HUD Göster: Sağda HTF mumlarını göster.
- HTF Mum Sayısı (maks 3): HTF mum sayısı (1–3).
- Sadece Kapalı HTF Çubuğu Kullan: Doğruysa, sadece kapalı HTF mumları kullanılır (kararlı değerler). Yanlışsa, mevcut açık mum dahil edilir.
- Mum Sağ Ofseti (çubuklar): Mevcut TF'deki son çubuktan sağa doğru çubuk ofseti (dayanak).
- Mum Genişliği (çubuklar): Mevcut TF çubuklarında mum dikdörtgeninin genişliği.
- Mum Aralığı (çubuklar): Mumlar arasındaki boşluk.
- Mum Çizgi Kalınlığı: Mum çizgi kalınlığı.
- HTF Boğa Rengi / HTF Ayı Rengi: Boğa/ayı mumları için renkler.
- HTF Fitil Rengi: Fitiller için renk.
- Çizgi Geçersiz Kılmayı Kullan: Doğruysa, mum gövdesi çizgiyle (Çizgi Rengi) çizilir, boğa/ayı dolgu olmadan.
- Çizgi Rengi: Çizgi Geçersiz Kılma = doğru olduğunda çizgi rengi.
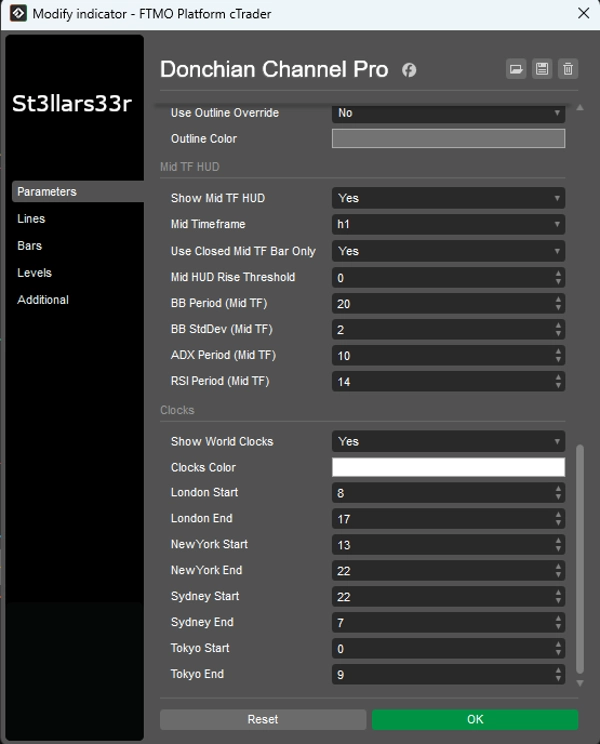
Grup: Orta TF HUD (Sağ Alt)
- Orta TF HUD Göster: Ara TF için HUD'u etkinleştirir.
- Orta Zaman Dilimi: Ara TF seçin (örneğin, Dakika15).
- Sadece Kapalı Orta TF Çubuğu Kullan: HTF ile aynı, ancak Orta TF için.
- Orta HUD Yükseliş Eşiği: Orta TF HUD için renk duyarlılığı.
- BB Periyodu (Orta TF), BB StdSapma (Orta TF): Orta TF için Bollinger Bantları ayarları.
- ADX Periyodu (Orta TF), RSI Periyodu (Orta TF): Orta TF için ADX ve RSI periyotları.
Grup: Saatler (Alt Orta)
- Dünya Saatlerini Göster: Saatler ve oturum Y/D bloğunu göster.
- Saatlerin Rengi: Saatler/oturumlar için metin rengi.
- Londra Başlangıç / Londra Bitiş: Londra oturumu için başlangıç/bitiş saatleri.
- NewYork Başlangıç / NewYork Bitiş: New York için.
- Sydney Başlangıç / Sydney Bitiş: Sydney için.
- Tokyo Başlangıç / Tokyo Bitiş: Tokyo için.
Saatler: Şehirler için gerçek yerel zamanı gösterir (işletim sistemi saat dilimleri üzerinden, yedek ofset ile).
- Oturum etkinliği (ve Y/D) hesaplamaları broker sunucu zamanını (Server.Time) kullanır. Sunucu UTC'de değilse, oturum saatleri kayabilir—sunucunuza göre Başlangıç/Bitişi ayarlayın.
- Bir oturum gece yarısını geçerse (Bitiş < Başlangıç), gösterge tarih geçişini otomatik olarak hesaba katar.
- Bir oturum aktif değilse, son tamamlanan oturumun Y/D'si gösterilir; yeni oturum başladığında veriler sıfırlanır ve yeniden hesaplanır.
Özet
Müşteri değerlendirmeleri
5 | 50 % | |
4 | 50 % | |
3 | 0 % | |
2 | 0 % | |
1 | 0 % |


