
Market Entropy
지표
107 다운로드
버전 1.0, Aug 2025
Windows, Mac
설명
시장 엔트로피는 시장 조직을 정량화하고 질서 → 전환 → 혼돈 전반에 걸쳐 체제 변화를 표시하는 이중 지표(오실레이터 + 선택적 가격 오버레이)입니다. 트렌드니스(DC)라는 두 번째 선을 추가하여 진정한 추세와 변동성 스퀴즈를 구분합니다.
작동 원리:
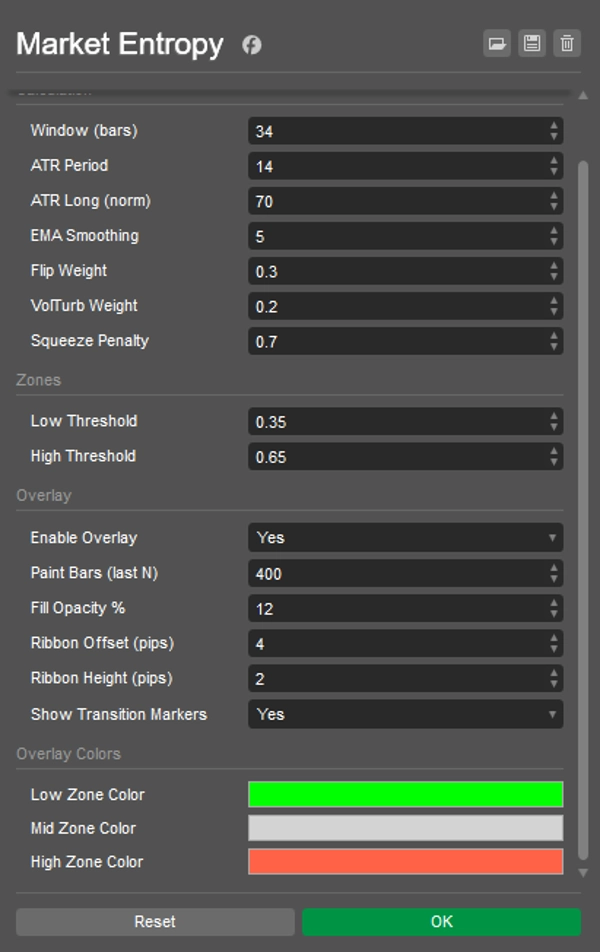
- OHLCV 구성 요소만 사용: DC (방향 일관성), FlipRate (부호 전환), Volatility_n (ATR/ATRlong), VolumeTurb (ΔVolume의 표준편차).
- 원시 엔트로피:
E0 = 0.5*(1-DC) + 0.3*(FlipRate*VolN) + 0.2*VolumeTurb). - 안티 스퀴즈 항은 ATR 압축 동안 E를 낮추어 → EMA 평활을 적용한 최종 엔트로피 ∈ [0..1]를 만듭니다.
- 마커:
-
- CRYSTAL — LowThr 아래로 교차 (질서가 나타남: 추세 또는 사전 붕괴 스퀴즈).
- DISSOLVE — HighThr 위로 교차 (질서 붕괴: 혼돈/추세 약화).
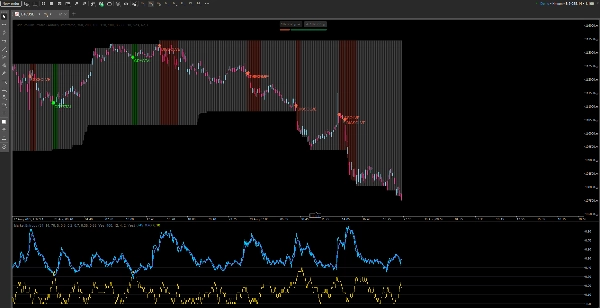
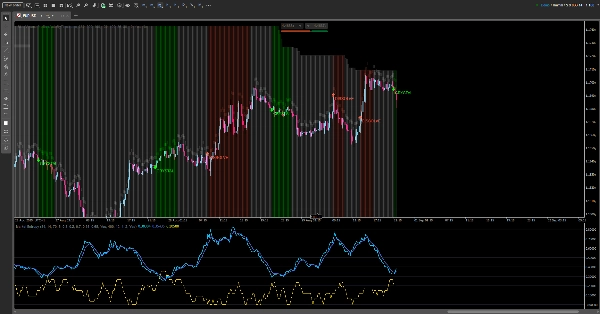
보이는 것:
- 패널에: 엔트로피, 엔트로피(EMA), 트렌드니스 (DC), 저/고 임계값, 구역 배경.
- 차트에서 (토글 가능): 상태 색상 막대, 고점 위의 얇은 리본, 그리고 CRYSTAL/DISSOLVE 마커.
읽기 가이드:
- E < LowThr → 질서:
-
- 높은 DC와 함께 → 조직된 추세;
- 낮은 ATR와 함께 → 스퀴즈 (붕괴 예상).
- LowThr…HighThr → 전환: 구조 형성 중; 해석을 기다리세요.
- E > HighThr → 혼돈: 불확실성 / 추세 약화; 단순한 연속 진입은 피하세요.
플레이북:
- 스퀴즈 → CRYSTAL → 돌파/재테스트 — 돌파를 거래하세요.
- 추세 → DISSOLVE — 일부 청산하거나 리스크를 조절하세요.
요약
지표 프로필
고객 리뷰
0.0
리뷰: 0
고객 리뷰
이 상품에 대한 리뷰가 아직 없습니다. 이미 사용해 보셨나요? 다른 사람들에게 가장 먼저 소개해 주세요!
상담
자주 묻는 질문(FAQ)
트레이딩 봇, 지표, 플러그인 등 cTrader Store에서 제공되는 상품은 제3자 개발자에 의해 제공되며, 이는 단순히 정보 및 기술적 접근을 목적으로 제공된 것입니다. cTrader Store는 중개인이 아니며, 투자 조언, 개인별 추천 또는 향후 성과에 대한 어떠한 보장도 제공하지 않습니다.


가격
가입일 26/05/2025
388.58M
거래량
60.75K
핍 수익
15
판매
1.41K
무료 설치