
Candle Timer & Strength Demo
지표
267 다운로드
버전 1.0, Jul 2025
Windows, Mac
설명
주요 특징:
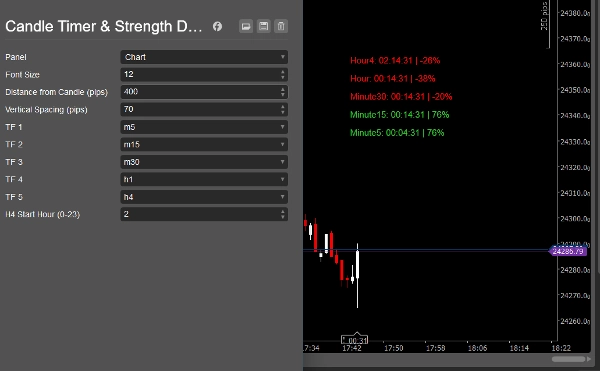
- 다중 타임프레임 캔들 타이머:
최대 5개의 선택된 타임프레임에서 다음 캔들 마감까지의 카운트다운을 하나의 명확한 패널에서 확인하세요. - %로 표시되는 캔들 강도:
각 타임프레임별로 현재 캔들의 강도(-100%에서 +100%까지)를 캔들의 범위 내 마감 위치를 기준으로 즉시 확인할 수 있습니다. - 사용자 정의 가능한 패널:
-
- 글꼴 크기, 마지막 캔들로부터의 거리, 수직 간격을 설정하세요.
- 선호하는 타임프레임을 선택하세요 (M1, M5, M15, M30, H1, H4 등).
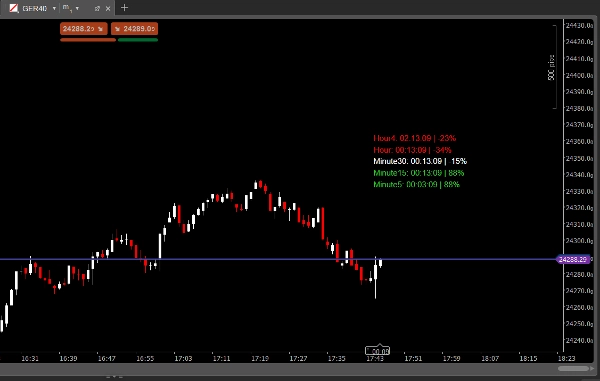
- 색상은 자동으로 변경됩니다: 강한 상승은 녹색, 강한 하락은 빨간색, 중립은 흰색.
- 항상 표시됨:
패널은 차트에 항상 표시되어 시장 타이밍과 모멘텀을 한눈에 쉽게 모니터링할 수 있습니다. - 적합 대상:
-
- 정확한 캔들 타이밍이 필요한 스캘퍼 및 데이 트레이더.
- 모멘텀과 타이밍을 한 곳에서 보고 싶은 다중 타임프레임 트레이더.
- 진입/청산 타이밍과 캔들 읽기 능력을 향상시키고 싶은 모든 사람.
작동 원리:
- 지표는 선택된 각 타임프레임에 대해 현재 캔들 마감까지 남은 시간을 계산합니다.
- 또한 캔들의 강도를 백분율로 계산합니다:
-
- +100% = 캔들 최상단에서 마감 (강한 상승)
- -100% = 캔들 최하단에서 마감 (강한 하락)
- 0% = 중간에서 마감 (중립)
- 패널은 실시간으로 업데이트되며 완전히 사용자 정의 가능합니다.
매개변수:
- 글꼴 크기
- 캔들로부터의 거리 (핍)
- 수직 간격 (핍)
- 타임프레임 1–5 (사용자 정의)
- H4 시작 시간 (비표준 H4 캔들을 사용하는 브로커용)
왜 Candle Timer & Strength를 선택해야 하나요?
- 시간 절약: 더 이상 타임프레임을 전환하거나 캔들 마감을 머릿속으로 계산할 필요가 없습니다.
- 자신감 있는 거래: 시장이 모멘텀을 얻고 있는지 잃고 있는지를 즉시 확인할 수 있습니다.
- 전문적인 외관: 깔끔하고 현대적인 패널이 모든 차트 스타일에 어울립니다.
- 사용하기 쉬움: 플러그 앤 플레이, 코딩 불필요.
참고:
이 데모는 평가 목적으로만 제공됩니다.
지표가 마음에 드시면 무제한 사용을 위해 전체 버전을 구매해 주세요.
전체 버전을 받으려면 cTrader 스토어에서 "Candle Timer & Strength"를 검색하세요.
내 모든 지표와 봇 보기:
https://ctrader.com/pl?search=kobud.222&u=kobud.222
http://www.youtube.com/@Robi22-22
📩 질문? 제안? 할인?
내 프로필에서 연락 가능: Robikobud
요약
AI 요약
Candle Timer & Strength Demo for cTrader is an indicator designed to display real-time countdowns to the close of current candles across up to five customizable timeframes. It provides a clear panel showing the remaining time until candle close and the candle’s strength as a percentage, ranging from -100% (strong bearish) to +100% (strong bullish), based on the candle’s close position relative to its range. The panel is fully customizable, allowing users to adjust font size, vertical spacing, distance from the last candle, and select preferred timeframes such as M1, M5, M15, M30, H1, and H4. Colors dynamically indicate momentum: green for strong bullish, red for strong bearish, and white for neutral. The panel remains always visible on the chart, facilitating quick assessment of market timing and momentum. This tool is suited for scalpers, day traders, and multi-timeframe traders seeking precise candle timing and momentum insights to improve entry and exit decisions. Parameters include font size, spacing, timeframe selection, and H4 start hour adjustment for brokers with non-standard candle timings. This demo version is intended for evaluation purposes.
지표 프로필
고객 리뷰
0.0
리뷰: 0
고객 리뷰
이 상품에 대한 리뷰가 아직 없습니다. 이미 사용해 보셨나요? 다른 사람들에게 가장 먼저 소개해 주세요!
상담
자주 묻는 질문(FAQ)
트레이딩 봇, 지표, 플러그인 등 cTrader Store에서 제공되는 상품은 제3자 개발자에 의해 제공되며, 이는 단순히 정보 및 기술적 접근을 목적으로 제공된 것입니다. cTrader Store는 중개인이 아니며, 투자 조언, 개인별 추천 또는 향후 성과에 대한 어떠한 보장도 제공하지 않습니다.
이 작성자의 상품 더 보기


가격
가입일 31/12/2024
7
판매
1.14K
무료 설치