
Penerangan
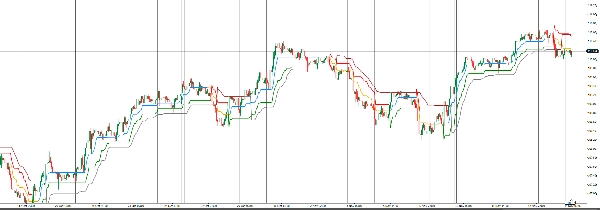
Penunjuk Triple Momentum adalah alat analisis teknikal yang komprehensif untuk platform cTrader, direka untuk memberikan pedagang pandangan pelbagai aspek mengenai momentum pasaran. Dengan menggabungkan tiga penunjuk mengikuti tren yang kuat menjadi satu, ia membantu pengguna mengesahkan isyarat, mengenal pasti kekuatan tren, dan membuat keputusan perdagangan yang lebih bermaklumat. Penunjuk ini dipaparkan terus pada carta harga utama untuk analisis yang lancar.
Komponen Teras:
- Garis 1: Garis tren responsif yang dibina khas menggunakan Bollinger Bands breakout untuk menentukan arah awalnya. Penapis ATR pilihan membantu melicinkan pergerakannya, mewujudkan tahap sokongan dan rintangan dinamik yang mengikuti harga. Garis ini berwarna Dodger Blue semasa tren menaik dan Orange semasa tren menurun.
- Garis 2: Penunjuk tren klasik dan banyak digunakan berdasarkan Purata Julat Benar (ATR). Ia memberikan isyarat beli dan jual yang jelas apabila harga melintasi di atas atau di bawah nilainya. Komponen ini termasuk:
-
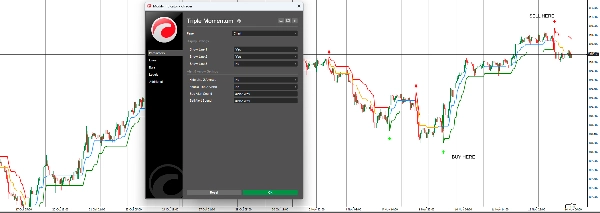
- Anak Panah Pada Carta: Anak panah naik/turun visual muncul pada setiap perubahan tren.
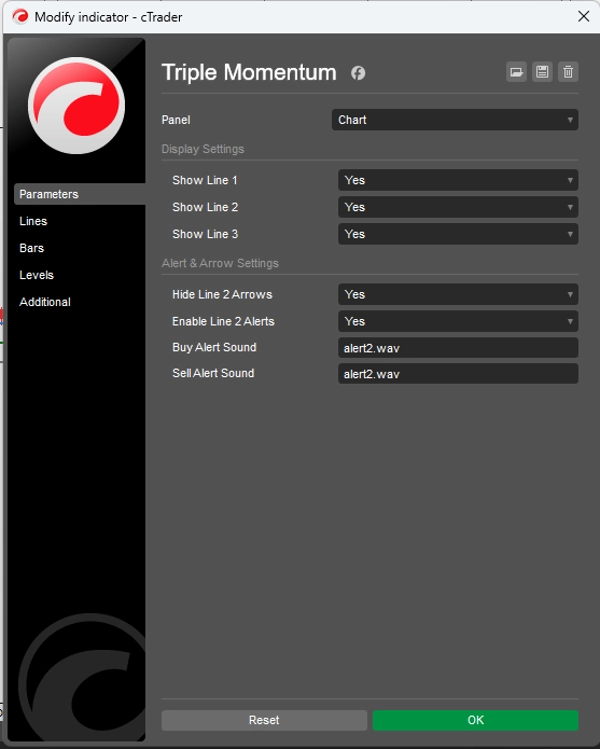
- Amaran Boleh Disesuaikan: Pengguna boleh mengaktifkan amaran pop-up dan bunyi untuk isyarat beli/jual, memastikan mereka tidak terlepas kemasukan atau keluar yang berpotensi.
- Garis 3: Berdiri untuk "Profitable Maximum," ini adalah penunjuk berasaskan ATR yang kukuh yang menggunakan purata bergerak sebagai terasnya. Ia direka untuk menangkap tren kuat sambil menapis bunyi pasaran kecil. Warna garis mencerminkan momentum asas: Kelabu untuk tren menaik (beli) dan Coklat untuk tren menurun (jual).
Ciri-ciri Utama:
- Boleh Disesuaikan Sepenuhnya: Setiap daripada tiga garis penunjuk boleh dihidupkan atau dimatikan secara bebas dari menu tetapan.
- Isyarat Visual Jelas: Garis berwarna kod dan anak panah pilihan memudahkan untuk mentafsir tren pasaran dengan cepat.
- Sistem Amaran Terintegrasi: Kekal diberitahu tentang perubahan tren utama dengan amaran pop-up dan bunyi yang boleh dikonfigurasikan untuk isyarat SuperTrend.
Dengan menggabungkan tiga pengiraan berbeza ini, penunjuk Triple Momentum menawarkan sistem yang kukuh untuk pengesahan tren, membolehkan pedagang mendekati pasaran dengan keyakinan yang lebih tinggi.
Ringkasan
Ringkasan AI
The Triple Momentum indicator for cTrader is a technical analysis tool designed to provide a comprehensive view of market momentum by combining three trend-following components into one indicator displayed on the main price chart.
Core components include:
1. A custom trend line based on Bollinger Bands breakouts with an optional ATR filter, serving as a dynamic support and resistance level. It changes color to Dodger Blue for uptrends and Orange for downtrends.
2. An ATR-based trend indicator that signals buy and sell points when price crosses its value, featuring on-chart arrows and customizable pop-up and sound alerts for trend changes.
3. The "Profitable Maximum," another ATR-based line using a moving average to capture strong trends while filtering noise, colored Gray for bullish trends and Brown for bearish trends.
Key features allow independent toggling of each line, clear color-coded visual signals, and an integrated alert system for SuperTrend signals. This indicator supports analysis across multiple markets including forex, indices, commodities, stocks, and cryptocurrencies, aiding traders in confirming trends and making informed decisions.
Profil indikator
Ulasan pelanggan
0.0
Ulasan: 0
Ulasan pelanggan
Belum ada ulasan untuk produk ini. Anda sudah mencuba produk tersebut? Jadilah yang pertama untuk berkongsi pendapat anda!
Perbincangan
Soalan Lazim
Signal
Indices
Commodities
GBPUSD
RSI
Bollinger
Fibonacci
Scalping
AI
XAUUSD
NAS100
MACD
BTCUSD
Forex
Breakout
EURUSD
NZDUSD
Martingale
Prop
ZigZag
Supertrend
Fair Value Gap
SMC
Crypto
Stocks
ATR
USDJPY
VWAP
Produk yang tersedia melalui cTrader Store, termasuk bot dagangan, indikator dan plugin, disediakan oleh pembangun pihak ketiga dan diberikan akses untuk tujuan maklumat dan teknikal sahaja. cTrader Store bukan broker dan tidak memberikan nasihat pelaburan, syor peribadi atau sebarang jaminan prestasi masa hadapan.


![Logo "[Hamster-Coder] Pivot Points MTF"](https://cdn.ctrader.com/image/webp/4c143e5a-309c-40e3-a578-f04d1e133ffa_31159)


Harga
Sejak 02/07/2025
1
Jualan