
Fixed Range Volume Profile
Indikator
2 pembelian
Versi 1.0, Jan 2026
Windows, Mac
4.0
Ulasan: 2
Penerangan
Cara Menggunakan Fixed Range Volume Profile (FRVP)
- Aktifkan Penunjuk: Seret dan lepaskan Penunjuk FRVP ke carta pilihan anda dari menu cTrader Automate atau Indicators.
- Pilih Alat Analisis: Cari Alat Lukisan Segi Empat Biasa dalam bar alat cTrader (biasanya di sebelah kanan atau kiri platform).
- Tentukan Julat Anda: Klik dan seret segi empat tersebut ke atas tindakan harga dan tempoh masa tertentu yang ingin anda analisis.
- Mulakan Profil: Selepas melukis, klik dan gerakkan segi empat itu sedikit. "Jabat tangan" antara lukisan dan penunjuk ini mencetuskan pengiraan volum, serta-merta menjana histogram, POC, dan garis Kawasan Nilai.
- Laraskan Secara Dinamik: Anda boleh menyeret tepi segi empat untuk mengembangkan julat masa atau memindahkannya ke kaki harga yang berbeza; profil volum akan mengira semula secara automatik untuk mencerminkan kawasan baru.
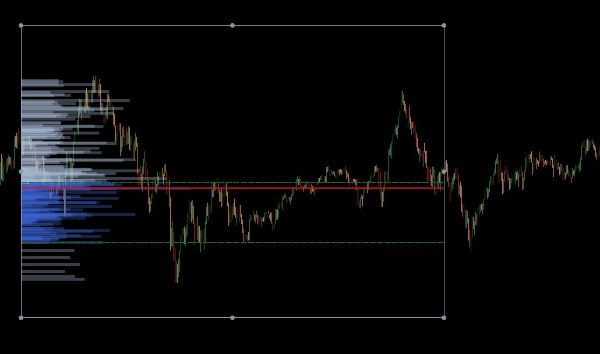
The Fixed Range Volume Profile (FRVP) untuk cTrader adalah alat analisis canggih yang direka untuk mengenal pasti tahap harga penting dengan mengira pengedaran volum sepanjang julat masa dan harga tertentu. Berbeza dengan penunjuk volum standard yang berkaitan dengan masa, penunjuk ini menumpukan pada ketumpatan harga untuk mendedahkan sentimen pasaran.
Ciri Utama
- Pemilihan Julat Dinamik: Penunjuk mengira dan mengemas kini secara automatik setiap kali anda melukis atau menggerakkan segi empat biasa pada carta cTrader anda.
- Pengenalpastian Tahap Utama:
-
- Point of Control (POC): Menonjolkan tahap harga dengan volum dagangan tertinggi, bertindak sebagai "magnet" untuk tindakan harga.
- Value Area High/Low (VAH/VAL): Menentukan sempadan di mana peratusan volum tertentu (lalai 40%) telah didagangkan.
- Susun Atur Boleh Disesuaikan:
-
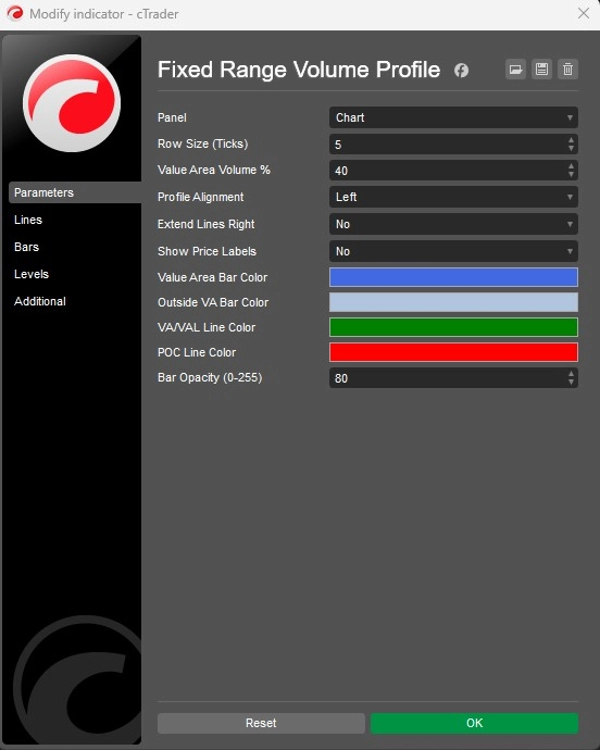
- Penjajaran: Pilih untuk memaparkan histogram volum dari Kiri atau Kanan sisi kotak.
- Granulariti: Laraskan Saiz Baris (lalai 5 ticks) untuk mengawal butiran bar volum.
- Visual: Kawalan penuh ke atas warna bar (Kawasan Nilai vs. Luar), kelegapan, dan keterlihatan label harga.
Aplikasi Strategik
- Sokongan & Rintangan: Nod Volum Tinggi (HVN) sering bertindak sebagai sokongan atau rintangan yang kuat, manakala Nod Volum Rendah (LVN) mewakili kawasan "nipis" di mana harga mungkin bergerak dengan cepat.
- Pengesahan Trend: Gunakan ciri Extend Right untuk melihat bagaimana tahap volum sejarah berinteraksi dengan tindakan harga semasa ketika ia berkembang.
Ringkasan
Ringkasan AI
The Fixed Range Volume Profile (FRVP) indicator for cTrader analyzes volume distribution within a user-defined price and time range using a standard rectangle drawing tool. By selecting and adjusting this rectangle on the chart, the indicator dynamically calculates and displays a volume histogram along with key levels: Point of Control (POC), which marks the price with the highest traded volume, and Value Area High/Low (VAH/VAL), defining the volume concentration boundaries. Users can customize the histogram’s alignment, granularity (row size), colors, opacity, and price label visibility. The indicator supports dynamic range adjustments by dragging the rectangle edges, automatically recalculating volume data. Strategically, it helps identify support and resistance zones through high and low volume nodes and offers trend confirmation by extending volume levels into current price action. The FRVP is applicable across various markets including Forex, cryptocurrencies, commodities, indices, and stocks, and supports symbols such as BTCUSD, EURUSD, GBPUSD, XAUUSD, and NAS100. It integrates with cTrader’s drawing tools and provides a detailed volume-based perspective on price action beyond standard time-based volume indicators.
Profil indikator
Ulasan pelanggan
4.0
Ulasan: 2
5 | 0 % | |
4 | 100 % | |
3 | 0 % | |
2 | 0 % | |
1 | 0 % |
Perbincangan
Soalan Lazim
BTCUSD
Forex
Signal
Breakout
Indices
EURUSD
Commodities
GBPUSD
NZDUSD
Fibonacci
Prop
Scalping
Fair Value Gap
SMC
Crypto
Stocks
XAUUSD
NAS100
USDJPY
VWAP
Produk yang tersedia melalui cTrader Store, termasuk bot dagangan, indikator dan plugin, disediakan oleh pembangun pihak ketiga dan diberikan akses untuk tujuan maklumat dan teknikal sahaja. cTrader Store bukan broker dan tidak memberikan nasihat pelaburan, syor peribadi atau sebarang jaminan prestasi masa hadapan.


Harga
Sejak 26/09/2025
14
Jualan