
Penerangan
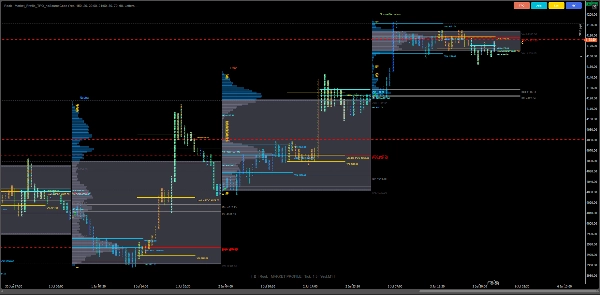
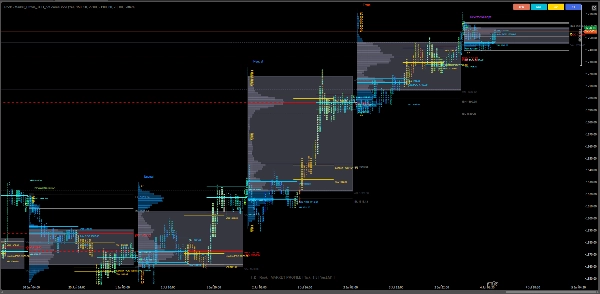
Market Profile TPO (Time Price Opportunity) membawa visualisasi struktur pasaran bertaraf institusi ke cTrader — membolehkan pedagang melihat bagaimana harga, masa, dan volum berinteraksi merentasi sesi dalam satu pandangan pintar.
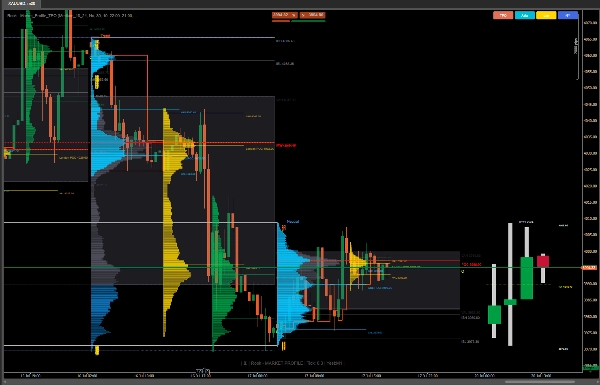
Direka untuk pedagang harian profesional, penganalisis pasaran lelongan, dan peminat aliran pesanan, penunjuk ini menyampaikan perwakilan sebenar aktiviti pasaran menggunakan huruf TPO, kotak, dan histogram. Ia membantu anda mengenal pasti kawasan nilai, zon POC, julat imbangan awal, dan tahap telanjang dengan ketepatan tepat.
⚙️ Ciri-ciri Teras
✅ Visualisasi (TPO)
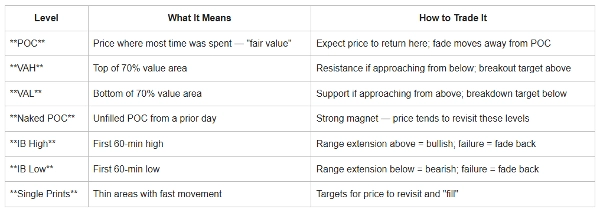
✅ Zon POC & Kawasan Nilai
✅ POC Berkembang
✅ Pengesanan Imbangan Awal (IB)
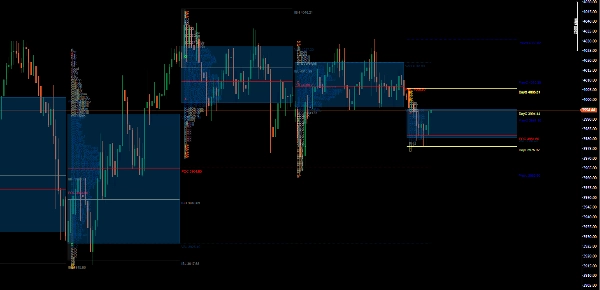
✅ Kecerdasan Sesi & Zon Masa
✅ Mod Paparan TPO (Huruf / Histogram)
✅ Penanda Harga Buka/Tutup (O/X)
✅ Cetakan Tunggal & Tahap POC/VA Telanjang
✅ Lapisan OHLC Hari & Hari Sebelumnya
✅ Lapisan OHLC Hari & Hari Sebelumnya
✅ Unjuran Bar HTF (AMD)
Penambahbaikan Utama
✔ Pemuatan lebih pantas
✔ Pengurusan memori lebih baik
✔ Pengiraan Kawasan Nilai yang tepat
✔ Penempatan profil sesi yang betul
✔ Prestasi togol lebih baik
✔ Keserasian merentas platform
✔ Sesi berasaskan UTC (tiada DST automatik)
✔ Pengendalian POC telanjang yang dipertingkatkan
✔ Rendering profil yang dipertingkatkan
🧭 Kes Penggunaan Perdagangan
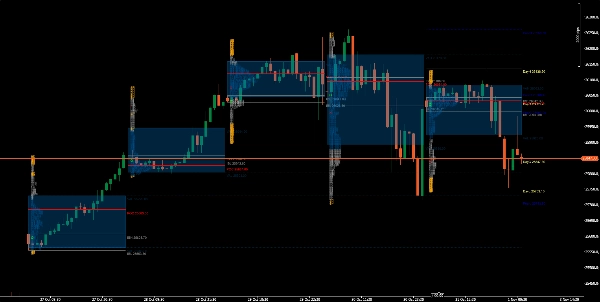
🔹 Analisis Lelongan Intraday — Kenal pasti di mana nilai terbentuk, berpindah, atau pecah.
🔹 Perdagangan POC & Pembalikan Nilai — Sasarkan ujian semula keseimbangan atau pengurangan ekstrem.
🔹 Pecahan Imbangan Awal — Kenal pasti apabila sesi berkembang melebihi julat sejam pertamanya.
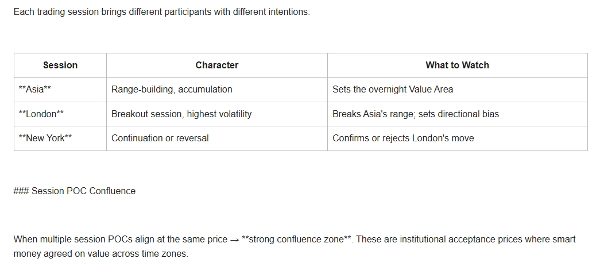
🔹 Kajian Putaran Sesi — Bandingkan profil merentasi sesi Asia, London, dan New York dengan penjajaran zon masa.
🔹 Pembinaan Konteks Institusi — Gabungkan dengan alat volum atau delta untuk mengesahkan jejak wang pintar.
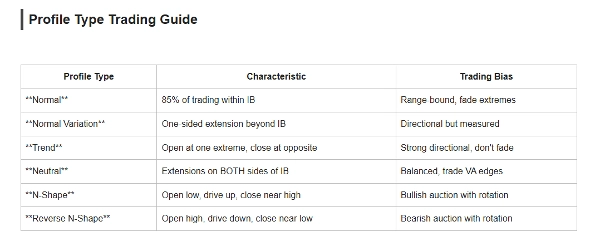
Jenis Profil
Jenis Keadaan Pasaran
Normal Pasaran Seimbang
Variasi Normal Trend Sederhana
Trend Hari Berarah Kuat
Neutral Lelongan Dua Hala
Lelongan Bullish Bentuk N
Lelongan Bearish Bentuk N Terbalik
Sesuai Untuk
- Teori Pasaran Lelongan (AMT)
- Pedagang Profil Pasaran
- Pedagang Intraday
- Pedagang Swing
- Pedagang Niaga Hadapan
- Pedagang Forex
- Analisis Aliran Pesanan Profesional
Bawa kejelasan institusi ke carta anda.
Penunjuk Market Profile TPO menukar data harga mentah menjadi cerita nilai, ketidakseimbangan, dan peluang
Penafian: Penunjuk ini disediakan untuk tujuan pendidikan dan maklumat sahaja dan tidak merupakan nasihat kewangan, pelaburan, atau perdagangan. Market Profile adalah alat analitik dan tidak menjamin keuntungan atau hasil masa depan.
Perdagangan pasaran kewangan melibatkan risiko yang besar, dan prestasi lalu tidak menjamin hasil masa depan. Pengguna bertanggungjawab sepenuhnya atas keputusan perdagangan, pengurusan risiko, dan sebarang keuntungan atau kerugian yang terhasil.
Sentiasa lakukan analisis anda sendiri dan berunding dengan profesional kewangan yang bertauliah sebelum membuat keputusan pelaburan atau perdagangan.
Ringkasan
Key features include multiple TPO display modes (letters and histogram), session and timezone intelligence with UTC-based sessions, open/close price markers (O/X), single prints, naked POC/VA levels, and overlays of day and previous day OHLC data. The indicator supports analysis of various market conditions through profile types like Normal (balanced market), Normal Variation (moderate trend), Trend (strong directional day), Neutral (two-sided auction), N-Shape (bullish auction), and Reverse N-Shape (bearish auction).
It is suitable for professional day traders, auction market analysts, order flow enthusiasts, and traders across Forex, indices, and commodities markets. Typical use cases include intraday auction analysis, POC and value reversion trades, initial balance breakouts, session rotation studies, and institutional context building when combined with volume or delta tools.
This indicator provides a detailed, structured view of market dynamics to support informed trading decisions based on Auction Market Theory and Market Profile principles.
Ulasan pelanggan
5 | 0 % | |
4 | 100 % | |
3 | 0 % | |
2 | 0 % | |
1 | 0 % |


