
Opis
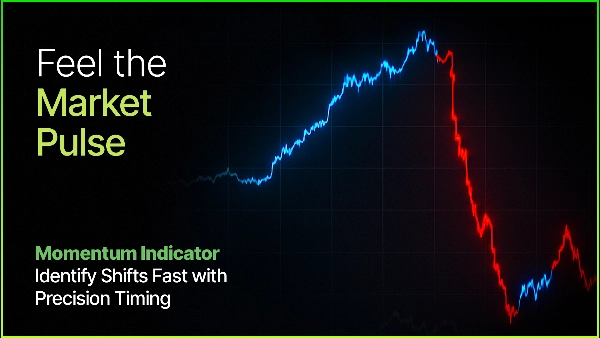
Amplitude Momentum Label — Adaptacyjne wykrywanie trendów oparte na zmienności
Amplitude Momentum Labeler łączy wiele zaawansowanych koncepcji:
- Wykrywanie reżimu — identyfikuje prawdziwe fazy trendu
- Adaptacja do zmienności — samodostosowuje się do aktualnych warunków rynkowych
- Dynamiczny VWAP — podkreśla istotne poziomy cofnięć i kontynuacji
- Estymator spreadu Rolla — sygnalizuje optymalne punkty ponownego wejścia podczas trendów
- MODUŁ OPTYMALIZACJI — z funkcją samooPTYMALIZACJI**
Tworzy to inteligentny, samodostosowujący się wskaźnik, który zapewnia przejrzystość, elastyczność i praktyczne strefy handlu — bez konieczności ciągłej ręcznej regulacji.
Co to jest?
Amplitude Momentum Labeler to wskaźnik wykrywania reżimu, który wskazuje, kiedy rynek wchodzi lub wychodzi z faz momentum wzrostowego lub spadkowego — w czasie rzeczywistym.
W przeciwieństwie do tradycyjnych przecięć średnich kroczących, mierzy rzeczywiste zmiany momentum, oceniając przesunięcie ceny i siłę odwrócenia.
Kluczowe pytanie
Czy rynek jest obecnie w fazie momentum — i w jakim kierunku?
Aby odpowiedzieć na to pytanie, wskaźnik śledzi:
- Amplitudę — jak daleko przesunęła się cena;
- Sekwencję — kolejność występowania maksimów i minimów.
Silny ruch, po którym następuje znaczące odwrócenie, oznacza początek nowego reżimu momentum.
Jak to działa
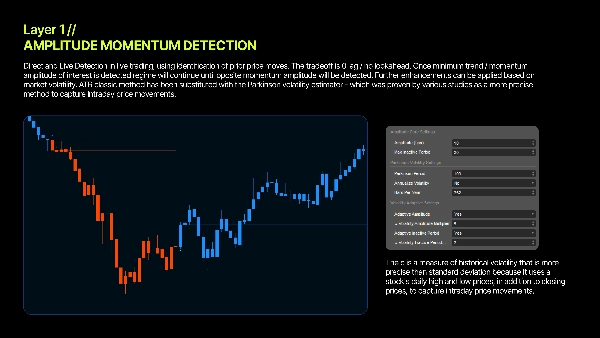
1. Pomiar huśtawki
Wskaźnik nieustannie aktualizuje najwyższe i najniższe ekstremalne ceny.
Ich różnica — amplituda — definiuje aktualny rozmiar huśtawki rynku.
2. Wykrywanie odwrócenia
- Ostry spadek, po którym następuje silny rajd → **Momentum wzrostowe**
- Ostry wzrost, po którym następuje silny spadek → **Momentum spadkowe**
3. Potwierdzenie znaczenia
Tylko odwrócenia przekraczające próg dostosowany do zmienności wywołują ważny sygnał.
4. Wykrywanie wyczerpania
Jeśli cena przestaje się rozwijać, wskaźnik identyfikuje wyczerpanie momentum i wraca do stanu neutralnego.
Zmienność Parkinsona — adaptacyjne progi
Większość wskaźników używa stałych parametrów. Ten dostosowuje się automatycznie. Dzięki zastosowaniu zmienności Parkinsona — która uwzględnia zakresy intraday wysokich/niskich cen — wskaźnik reguluje czułość na podstawie rzeczywistych warunków rynkowych. Efekt: spójna wydajność w cichych i zmiennych środowiskach. (Statystycznie udowodniona większa efektywność niż metoda ATR)
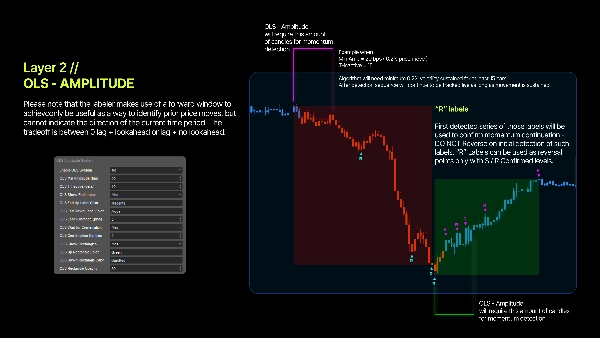
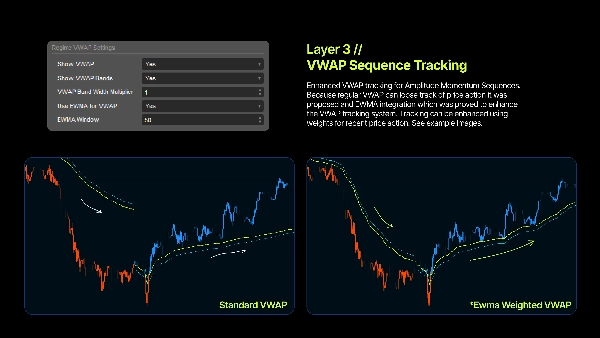
Reżimowy VWAP — dynamiczne poziomy do ponownego wejścia
Gdy reżim jest aktywny, wskaźnik oblicza VWAP specyficzny dla tego trendu, zapewniając dynamiczne poziomy wsparcia i oporu. Instytucje mocno polegają na VWAP, a cena często reaguje wokół niego — co czyni go idealnym do wejść po cofnięciach.
Tryb EWMA
Włącz EWMA, aby nadać większą wagę ostatnim cenom, tworząc gładszą i bardziej responsywną krzywą VWAP. Doskonałe do identyfikacji ponownych wejść podczas długotrwałych trendów.
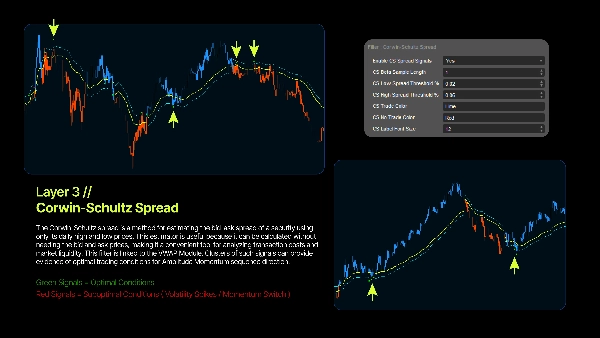
Estymator spreadu Rolla — dynamiczny filtr do ponownego wejścia
Estymator spreadu Rolla to metoda szacowania spreadu bid-ask na podstawie obserwowanych cen transakcji, zwykle wykorzystująca kowariancję szeregu zmian cen. Opracowany przez Rolla, zakłada, że kolejne transakcje na przemian dotyczą cen bid i ask, a nowe informacje nie przesuwają stale "prawdziwej" ceny. Choć prosty i podstawowy, oryginalna metoda została udoskonalona, aby rozwiązać problemy takie jak tendencja do zaniżania i słaba wydajność w niektórych zestawach danych. Estymator opiera się na założeniu, że jeśli nie pojawiają się nowe informacje, ceny będą się po prostu odbijać między bid a ask. Zakłada równą prawdopodobność transakcji inicjowanych kupnem i sprzedażą.
Korzyści z użytkowania
1. Obiektywna identyfikacja trendu - Bez linii trendu. Bez zgadywania. Matematyka definiuje reżim.
2. Adaptacja do zmienności - Automatycznie dostosowuje się do zmieniających się warunków za pomocą zmienności Parkinsona.
3. Jasne strefy wejścia - Poziomy reżimowego VWAP pomagają precyzyjnie określić intuicyjne obszary cofnięć i dobudowy pozycji.
4. Zdefiniowane granice reżimu - Dokładnie wiesz, kiedy momentum się zaczyna i kiedy się kończy.
5. Kompatybilność wieloczasowa - Normalizacja w punktach bazowych zapewnia spójne zachowanie na każdym wykresie.
Podstawa ilościowa
Logarytmiczne zwroty
Użycie zwrotów logarytmicznych zapewnia symetrię, czyniąc pomiar momentum matematycznie solidnym.
Punkty bazowe
Wszystkie obliczenia wykorzystują standardowe jednostki bps (1 bps = 0,01%), co pozwala na spójność między różnymi aktywami.
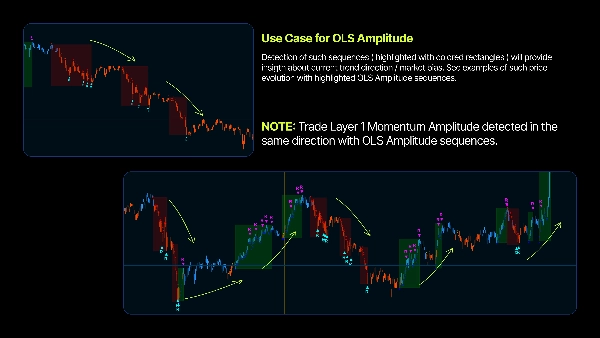
Wykrywanie cofnięć
Zmiany momentum są identyfikowane przez silne ruchy kierunkowe, po których następują znaczące ruchy przeciwnym kierunku (odwrócenia w kształcie litery V).
Syntetyczna objętość
Syntetyczna objętość oparta na zakresie i korpusie zapewnia dokładność VWAP dla każdego symbolu.
⎽⎽⎽⎽⎽⎽⎽⎽⎽⎽⎽⎽⎽⎽⎽⎽⎽⎽⎽⎽⎽⎽⎽⎽⎽⎽⎽⎽⎽⎽⎽⎽⎽⎽⎽⎽⎽⎽⎽⎽⎽⎽⎽⎽⎽⎽⎽⎽⎽⎽⎽⎽⎽⎽⎽⎽⎽⎽⎽⎽⎽⎽⎽⎽⎽⎽⎽⎽⎽⎽⎽⎽⎽⎽⎽⎽⎽⎽⎽⎽⎽⎽⎽⎽⎽⎽⎽⎽⎽⎽⎽⎽⎽⎽⎽⎽⎽⎽⎽⎽⎽⎽⎽⎽⎽⎽⎽⎽⎽⎽⎽⎽⎽⎽⎽
To narzędzie służy wyłącznie celom edukacyjnym i informacyjnym. Nie jest poradą inwestycyjną. Handel wiąże się z ryzykiem, a straty mogą przekroczyć depozyty. Wyniki historyczne nie gwarantują przyszłych rezultatów. Jesteś wyłącznie odpowiedzialny za wszystkie decyzje handlowe. Twórca nie ponosi odpowiedzialności za jakiekolwiek straty finansowe wynikające z używania wskaźnika. Zawsze przeprowadzaj własną analizę przed rozpoczęciem handlu.
Podsumowanie
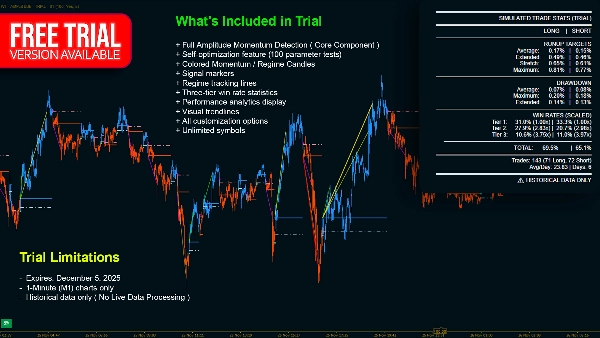
Key features include:
- **Regime Detection:** Pinpoints market entry and exit points for momentum trends.
- **Volatility Adaptation:** Uses Parkinson Volatility to self-tune sensitivity based on current market conditions, ensuring consistent performance across varying volatility.
- **Dynamic VWAP:** Calculates a volume-weighted average price specific to each trend regime, providing dynamic support and resistance levels for pullback and continuation entries.
- **Roll Spread Estimator:** Estimates bid-ask spreads to signal optimal re-entry points during trends.
- **Self-Optimization Module:** Automatically adjusts parameters without manual intervention.
The indicator operates by continuously tracking price extremes to measure swing amplitude, detecting significant reversals that exceed volatility-adjusted thresholds, and identifying momentum exhaustion when price progression stalls. It uses logarithmic returns and basis-point normalization for mathematically robust, cross-asset consistency. Synthetic volume calculations enhance VWAP accuracy across symbols.
This tool supports multiple markets including Forex, stocks, indices, commodities, and cryptocurrencies, and is compatible with various timeframes. It outputs visual signals and filters to assist traders in objective trend identification and clear entry zone determination.
Opinie klientów
5 | 75 % | |
4 | 25 % | |
3 | 0 % | |
2 | 0 % | |
1 | 0 % |


