




설명
> HyperFlow — cTrader용 트렌드 반전 거래 시스템
일중 거래 및 스캘핑에서는 우위가 한 번 증명되는 것이 아니라 거래마다, 세션마다 지속되어야 합니다. 이는 가격 흐름과 추세 변화를 실제로 신뢰할 수 있는 신호로 실시간으로 읽어야 하며, 움직임이 이미 끝난 후에야 명확해지는 확인 신호에 의존해서는 안 된다는 뜻입니다. 실시간으로 추세와 모멘텀을 감지하는 신뢰할 수 있는 방법 없이는 일일 반복 가능한 결과를 유지하기 어렵습니다.
HyperFlow는 다른 접근 방식을 취합니다: 추세 논리가 적용되기 전에 가격 측정의 기본 단위를 재구성합니다. 트렌드 반전 바는 틱 데이터에서 직접 형성되며 실제 가격 변위가 있을 때만 닫히므로, 그 위에서 작동하는 추세 엔진은 경과 시간에 반응하는 것이 아니라 시장이 실제로 어떻게 움직이는지에 반응합니다. 모든 신호는 핍 단위로 추적 및 측정되어, 단순히 차트에 그려진 수준이 아니라 증거에 기반해 거래할 수 있습니다.
> HyperFlow 시스템에 포함된 내용은?
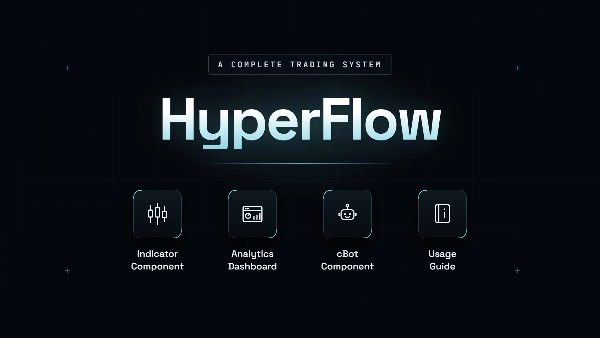
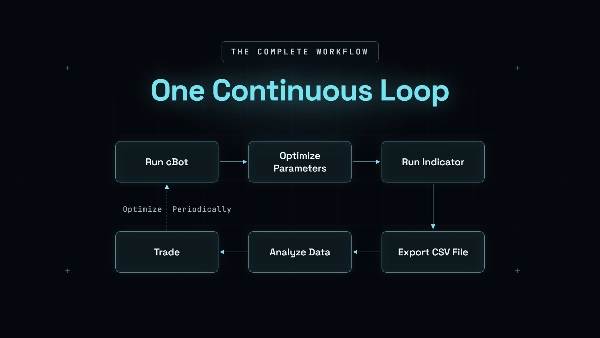
HyperFlow는 각 구성 요소가 서로를 지원하는 통합 워크플로우로 구축되었습니다. 전략을 최적화부터 실행까지 완성하는 완전한 워크플로우이며 다음을 포함합니다:
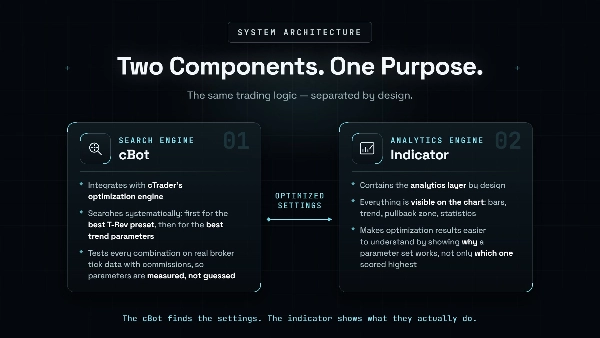
- HyperFlow 지표 – 트렌드 반전 바를 생성하고, HyperTrend 엔진을 실행하며, 추세 방향, 되돌림 수준, 알림 및 차트 색상을 표시합니다.
- HyperFlow cBot – 브로커 틱 데이터(수수료 포함)를 사용하여 지표와 동일한 논리로 매개변수 최적화를 수행합니다. 완전 자동 실행에도 사용할 수 있습니다.
- 실시간 시퀀스 통계 – 승률, 평균 및 중앙값 성과, 시간별 분포를 포함하여 완료된 모든 추세 구간을 핍 단위로 측정합니다.
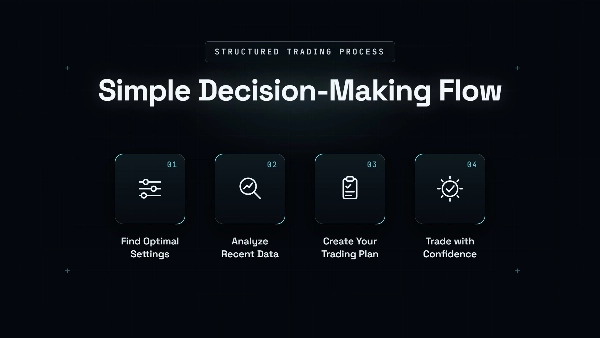
- 독점 분석 대시보드 – 내보낸 CSV 데이터를 가져와 거래 전 계획 도구로 변환합니다: 수익 곡선과 견고성 등급은 우위의 반복 가능성을 보여주고, 시간별 분석은 실제 거래 및 세션별 기대값을 드러내며, 캡 시뮬레이션은 현실적인 일일 위험과 보상을 모델링하여 단일 거래 전에 증거에 기반한 거래 계획을 수립합니다.
- 문서 및 온보딩 – 완전한 설정 가이드, 워크플로우 문서, 구매 후 라이브 온보딩 세션을 제공합니다.
결과적으로 분석부터 검증, 실행까지 완전한 프레임워크를 얻을 수 있습니다.
구매 후에는 개인 메시지를 통해 연락할 수 있으며, 모든 추가 자료와 지침이 별도로 제공됩니다.
> 시스템 작동 방식
HyperFlow는 시장을 설명하기 위해 만들어진 것이 아니라 거래를 위해 만들어졌습니다. 모든 계층은 cBot에서 최적화되고, 지표에서 읽히며, 대시보드에서 실제 결과와 대조되어 행동할 수 있도록 존재합니다. 시스템이 감지하는 구조는 처음부터 끝까지 사용해야 할 동일한 구조입니다.
가격 움직임 → 추세 감지 → 거래 신호 → 성과 측정
단계별로 어떻게 진행되는지 설명합니다:
1. 트렌드 반전 바
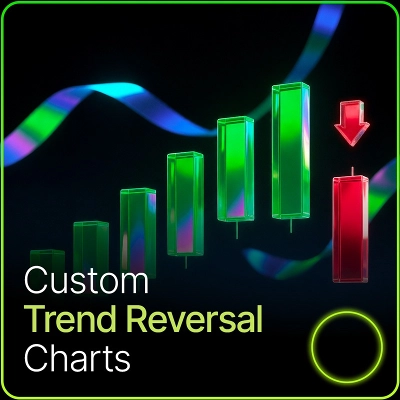
가격은 먼저 트렌드 반전 바로 재구성됩니다.
기존 캔들과 달리, 이 바들은 가격이 미리 정의된 틱 수만큼 움직인 후에만 생성됩니다:
- 트렌드 크기는 현재 방향으로의 움직임을 정의합니다.
- 반전 크기는 현재 방향에 반하는 움직임을 정의합니다.
바 형성은 경과 시간 대신 가격 움직임에 의존하기 때문에, 활동이 적은 기간에는 자연스럽게 바가 적게 생성되고, 활발한 시장에서는 더 많은 세부 정보가 생성됩니다.
2. HyperTrend 엔진
재구성된 바는 효율적인 이동평균과 ATR 기반 추세 밴드를 결합한 HyperTrend 엔진으로 분석됩니다.
엔진은 지속적으로 다음을 결정합니다:
- 현재 추세 방향
- 동적 추세 수준
- 되돌림 구역
- 추세 반전
이것이 전체 시스템에서 사용되는 시장 구조를 생성합니다.
3. 거래 신호
추세가 변할 때마다 HyperFlow는 다음을 통해 실행 가능한 정보를 생성합니다:
- 차트상의 추세 방향
- 되돌림 구역
- 예상 추세 수준
- 캔들 색상 변경
- 소리 및 팝업 알림
지표는 재량 거래에 필요한 정보만 강조하는 데 집중합니다.
4. 객관적 측정
모든 연속된 추세 구간은 확인부터 완료까지 자동으로 측정됩니다.
고립된 차트 예시에 의존하는 대신, HyperFlow는 모든 구간을 기록하고 다음을 보고합니다:
- 총 순 핍 및 승률
- 평균 및 중앙값 구간 길이
- 시간별, 세션별 및 주간 성과
- 시퀀스 분포
이것은 추세 감지를 측정 가능한 통계적 증거로 변환합니다.
> 차트 표시
지표를 연결하면 즉시 완전한 추세 거래 작업 공간을 제공합니다.
표시되는 요소는 다음과 같습니다:
- 트렌드 반전 바
- HyperTrend 방향
- 되돌림 구역
- 추세 추적 구역
- 차트 바 색상
- 사용자 정의 가능한 알림
- 실시간 성과 통계
결과는 불필요한 지표 대신 추세 구조를 강조하는 깔끔한 차트입니다.
> 자동화 및 사용 편의성
두 도구가 동일한 논리를 공유하므로 최적화, 시각적 분석 및 실시간 거래 간 불일치가 없습니다.
이를 통해 다음을 할 수 있습니다:
- 브로커의 정확한 틱 데이터를 사용하여 매개변수 최적화
- 테스트 중 스프레드 및 수수료 포함
- 최적화된 설정을 지표에 직접 전송
- 동일한 전략을 자동으로 실행
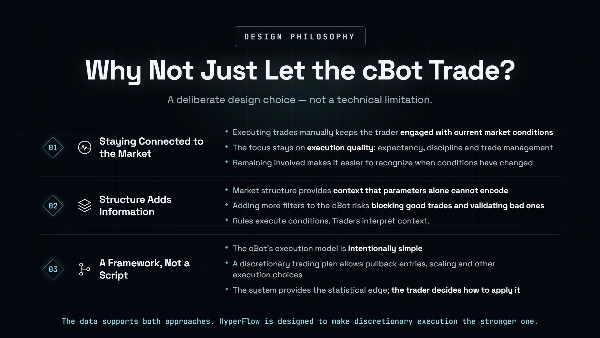
설정이 검증되면 테스트된 성과에 대한 신뢰를 가지고 전략을 수동으로 거래하거나 최적화된 cBot이 동일한 논리를 자동으로 실행하도록 할 수 있습니다.
> 설정
지표는 실제로 동작을 변경하는 매개변수만 노출하며 과부하는 없습니다.
주요 매개변수:
- 트렌드 크기 — 추세 바를 닫기 위해 가격이 추세 방향으로 움직여야 하는 틱 수
- 반전 크기 — 반전 바를 닫기 위해 가격이 반대 방향으로 움직여야 하는 틱 수
- 틱 크기 — 모든 임계값이 측정되는 세분화 단위
- MA / ATR 길이 — HyperTrend 엔진의 반응 속도 및 밴드 폭
- 세션 간격 — 거래 세션에 맞게 데이터 최적화 및 분석
개인별 프리셋이 제공되며, 완전한 맞춤형 기하학(역비율 포함)이 지원됩니다. 이는 시스템이 지속적인 재조정 없이 작동하기에 충분합니다.
> 거래 특성
- HyperFlow는 범위 거래보다는 추세 추종에 설계되었습니다.
- 신호는 빈도보다 품질을 우선시하며, 추세 변화는 완료된 트렌드 반전 바 이후에만 확인됩니다.
- 포함된 시퀀스 통계 및 시간별 분석은 선택한 구성 설정이 가장 잘 작동하는 시장 세션을 식별하는 데 도움을 줍니다.
- 기본 바 구성은 다양한 심볼에 자연스럽게 적응하므로 동일한 워크플로우를 여러 시장에서 검증할 수 있습니다.
> 시스템 및 관련 자료를 얻는 방법
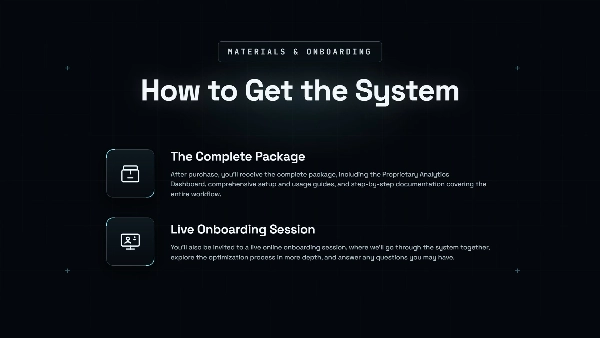
구매 후에는 독점 분석 대시보드, 포괄적인 설정 및 사용 가이드, 전체 워크플로우를 다루는 단계별 문서가 포함된 완전한 패키지를 받게 됩니다.
또한 라이브 온라인 온보딩 세션에 초대되어 시스템을 함께 살펴보고, 최적화 과정을 더 깊이 탐구하며, 궁금한 점에 답변해 드립니다.
요약
The indicator processes tick data directly within cTrader, displaying custom OHLC step-lines on any native timeframe without requiring external plugins. It includes the HyperTrend engine, which identifies bullish and bearish trends and defines two key zones: the pullback zone (common retracement area) and the failure zone (trend invalidation area).
HyperFlow tracks consecutive same-direction bar sequences from the moment a trend is confirmed, providing live statistics such as net pip performance, win rate, average sequence sizes, fixed-pip target analysis, and hourly profitability. Users can export detailed sequence and session data to CSV for advanced offline analysis.
Additional features include customizable trend/reversal distance settings, preset configurations, optional Kalman smoothing, session filtering, alerts for trend changes, and an indicator-to-cBot communication channel (in development). The package includes the indicator, an analytics dashboard, documentation, and onboarding support. HyperFlow supports structured intraday market analysis and strategy refinement based on user data.