Beschreibung
Standard charts show you the price. Delta Suite™ shows you why price is about to move.
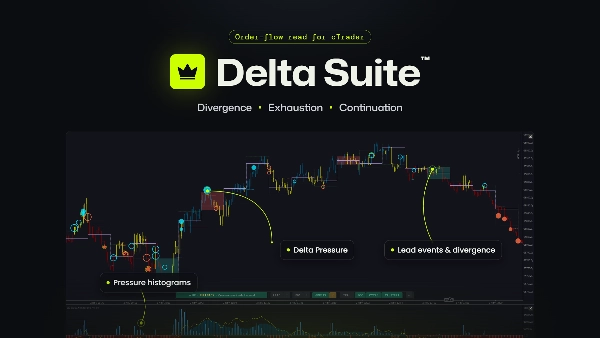
Raw delta is noisy. The signals that matter — divergence, exhaustion, continuation — only show up when delta is read in context. Delta Suite visualizes delta the way order flow traders actually need it: in real time, alongside structural levels, with a layout designed to surface the patterns that drive execution decisions on any market.
The idea
Moves start small. A push shows up over seconds, spreads to minutes, and only then becomes a trend. When it fades, the short horizons let go first.
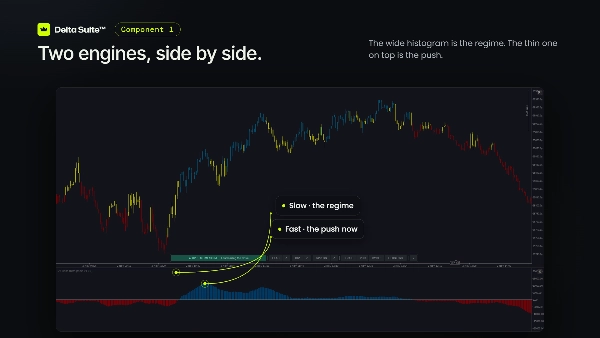
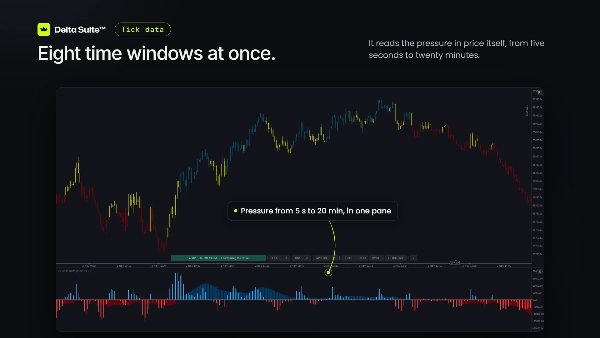
Delta Suite™ reads that sequence on every tick, across eight time windows from 5 seconds to 20 minutes, using a proprietary method with a self-calibrating noise filter. Two engines come out of it:
- Fast engine - momentum. The local push happening right now.
- Slow engine - regime. The sustained pressure that push lives in.
Every feature on the chart comes from comparing the two.
What you see on chart ( indicator features )
1 · Pressure histograms
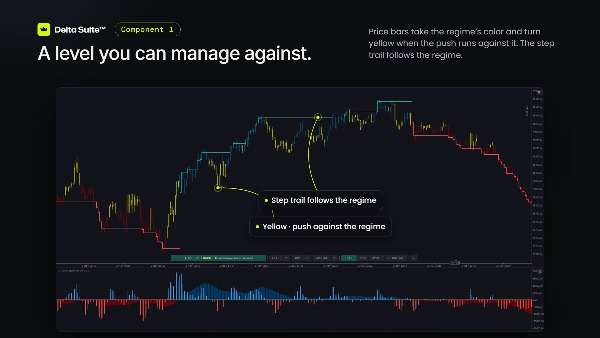
- A wide histogram for the regime and a thin one for the push, in their own pane.
- Same side of zero: the push works with the regime. Opposite sides: it runs against it.
- Regime bar colors: price bars take the regime's color and turn yellow when the push runs against it.
- Step trail: a level that follows the regime and only moves in its direction.
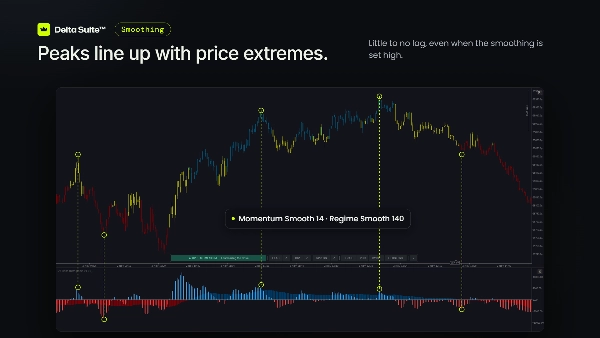
- Histogram peaks line up closely with price extremes, even with high smoothing.
2 · Lead events and divergence
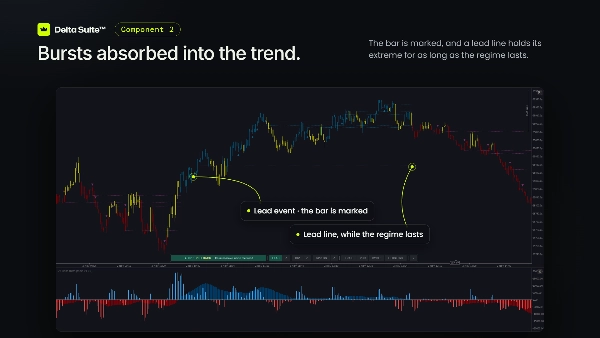
- Lead event ▲ ▼: the fast engine surges ahead of the regime, then falls back inside it.
- What it can mean:
- After a stretched run, it can point to a reversal.
- Early in a new regime, it marks the change of direction, and a break of its level can follow as the breakout.
- Lead levels:
- The regime's first event draws a line at its extreme.
- Every later event draws a box from the previous one.
- Lines and boxes run until the regime ends. Older boxes fade within each regime, so the latest step stands out.
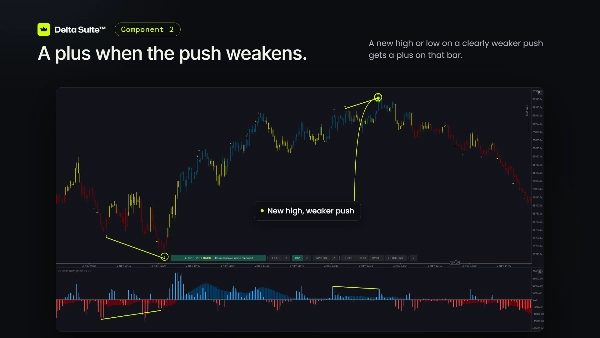
- Divergence "+": after a lead event, a new high or low on a clearly weaker push. Each further "+" needs an even weaker push.
3 · Δ Pressure
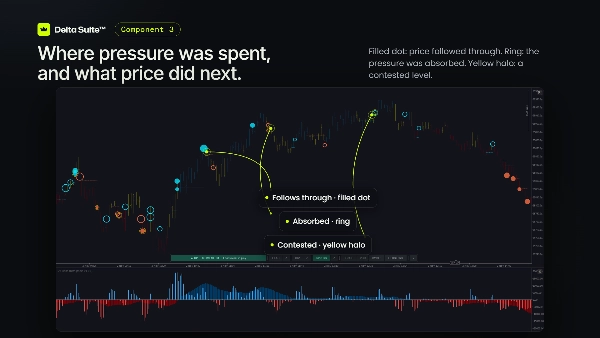
Marks the price levels where heavy, one-sided pressure was spent, once price has given its verdict:
● Filled dot : Price followed through
○ Ring : The pressure was absorbed; price went nowhere
Yellow halo : The push at that level fought the regime
- Color and size: a dot takes the color of the side that pushed; a ring takes the color of the side that absorbed it. The size shows how heavy the pressure was.
- Placement: each marker sits on the bar and price where it was decided, with a dotted line back to its level. It's final once drawn.
- Declutter: where markers would overlap, the strongest is drawn. Zoomed out, markers also need room side by side, so the strongest in each stretch remains. Zoom in and every marker returns.
4 · Time clusters
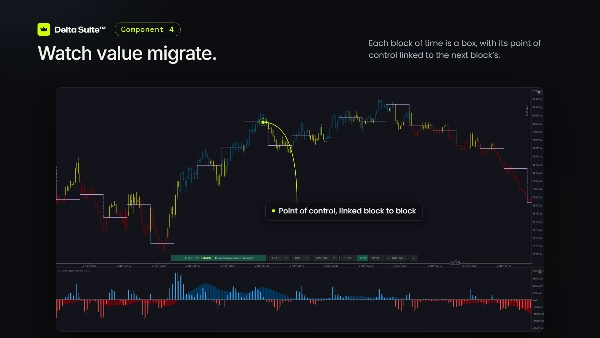
- Each trading day is split into blocks, from 5 minutes to a full day. Trading days are detected from the broker's Daily bars.
- Boxes show each block's full range, its body, or its value area.
- POC lines mark each block's point of control, linked block to block (step or diagonal) to show value migrating.
- Cluster divergence highlights blocks that make a new high or low on weaker pressure than recent blocks.
- Mixed clusters get a yellow outline where the push fought the regime. You choose the cluster values it checks: Average, Last, Peak, Any or All.
- Clustered View turns the histograms into one block per cluster (average, last or peak), lined up with the boxes.
5 · Δ Power panel
- A meter for each time window, at the right edge of the histogram pane. It shows how far the window leans bull or bear, and its current side.
- Slot levels on the price chart mark each window's open: the price where that window's side flips.
6 · Control
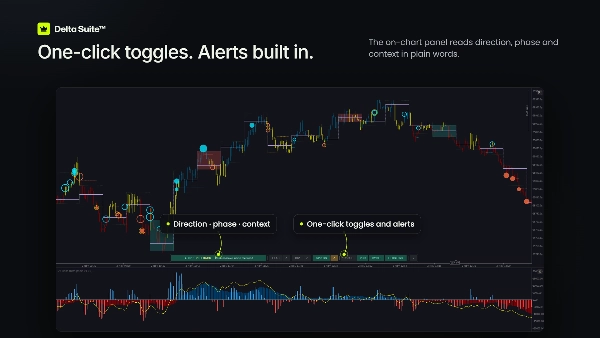
- Info panel: one row on the chart that reads the market in plain words, e.g.
▲ UP • MOMENTUM • Lead event in play. Hints describe the context and never suggest a trade. - One-click toggles: lead events, divergence, Δ Pressure, trail, POC, cycle, clusters and the power panel.
- Sound alerts for lead events, divergence and Δ Pressure, switched on from the panel.
- Trend Cycle (optional): an independent filter that shows how far price is stretched from its trend. Useful to filter and confirm the other signals.
A word on volume
On CFD symbols, platform volume is tick volume: a count of price changes. It carries no traded size and no buyer/seller split. Delta Suite™ reads pressure from price itself, so it runs on any cTrader symbol with tick data: FX, indices, metals and crypto. The value areas use tick activity as their activity measure.
How to read it
- Regime: whose market is it? Slow histogram, bar colors, trail.
- Push: is it with the regime or against it? Yellow bars, lead events, lead levels.
- Confirmation: do price and pressure agree? "+" markers, Δ Pressure rings and dots, cluster highlights.
Who it's for
- Intraday traders on 1–15 minute charts who want regime, pullbacks and exhaustion in one tool.
- Discretionary traders who want clear chart events to build rules around.
- Systematic traders who want closed-bar conditions they can test.
Price action knowledge still matters: the indicator gives you the read, and you make the decisions.
FAQ
Does it repaint?
Signals are set on closed bars and stay as drawn. Only the live bar's values and the developing cluster's highlight update in real time; the developing highlight is dashed and lighter.
Which timeframe works best?
The windows run on real time, up to 20 minutes, whatever the chart. On 1–15 minute charts each bar holds a meaningful slice of that range.
Can I declutter the chart?
Yes. Every layer has its own toggle on the info panel, and Δ Pressure thins itself out as you zoom out.
Zusammenfassung
Key functionalities include:
- Pressure histograms showing regime and push dynamics with color-coded bars and a step trail level.
- Lead events and divergence signals highlighting potential reversals or breakout points.
- Δ Pressure markers indicating price levels where significant one-sided pressure was either absorbed or followed through.
- Time clusters dividing trading days into blocks with range, value area, and point of control (POC) visualization.
- A Δ Power panel displaying bullish or bearish lean across time windows.
- An info panel providing plain-language market reads and toggles for all features, plus sound alerts for key events.
The indicator uses tick data volume, applicable to FX, indices, metals, and crypto on cTrader. It is suited for intraday traders on 1–15 minute charts, discretionary traders seeking clear chart events, and systematic traders requiring testable closed-bar conditions. Signals are fixed on closed bars to avoid repainting.