
Renko Line Chart
Indikator
1 pembelian
Versi 1.0, Jun 2025
Windows, Mac

Penerangan
✅ Menggunakan format profesional dengan hierarki yang jelas
✨ Mengapa Pedagang Menyukainya
"Akhirnya - penunjuk yang kelihatan secanggih strategi dagangan saya"
Ringkasan
Ringkasan AI
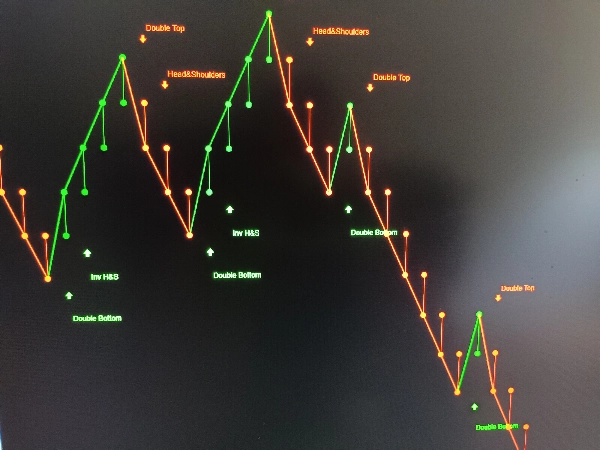
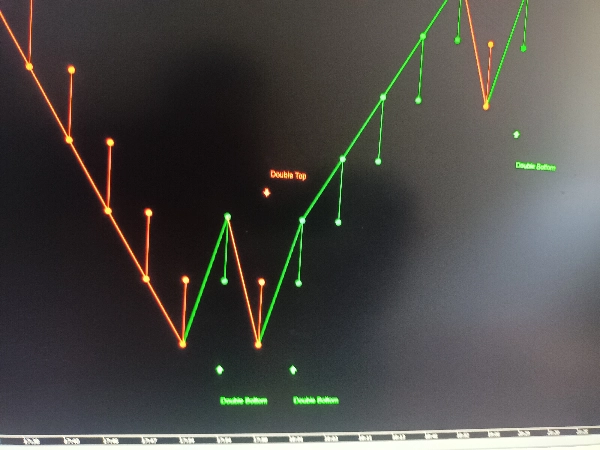
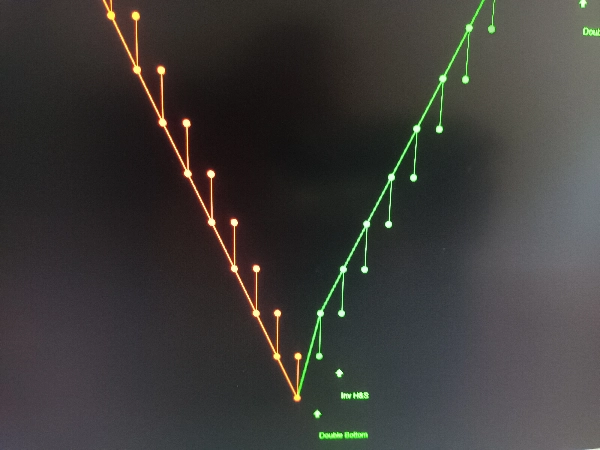
The Renko Line Chart is a trading indicator designed to present price movements with professional formatting and a clear hierarchical structure. It visually represents trend reversals and patterns using Renko charting techniques, which filter out minor price fluctuations to highlight significant market trends. This indicator aims to provide traders with a sophisticated and clear view of market dynamics, supporting decision-making based on trend signals. It is suitable for integration into various trading strategies that benefit from trend analysis and pattern recognition.
Profil indikator
Ulasan pelanggan
0.0
Ulasan: 0
Ulasan pelanggan
Belum ada ulasan untuk produk ini. Anda sudah mencuba produk tersebut? Jadilah yang pertama untuk berkongsi pendapat anda!
Perbincangan
Soalan Lazim
Produk yang tersedia melalui cTrader Store, termasuk bot dagangan, indikator dan plugin, disediakan oleh pembangun pihak ketiga dan diberikan akses untuk tujuan maklumat dan teknikal sahaja. cTrader Store bukan broker dan tidak memberikan nasihat pelaburan, syor peribadi atau sebarang jaminan prestasi masa hadapan.
Lebih banyak produk daripada penulis ini


Harga
Sejak 28/01/2025
7
Jualan
351
Pemasangan percuma