
TrendStrengthSignals
지표
버전 1.0, Aug 2025
Windows, Mac
5.0
리뷰: 1
설명
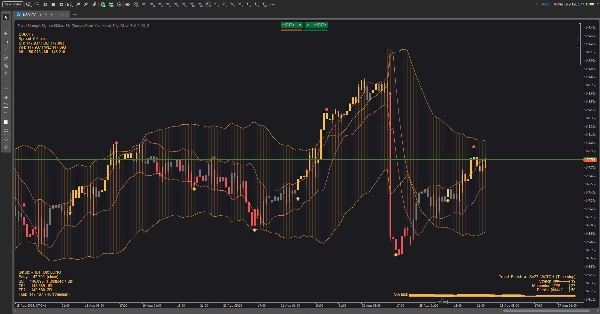
변동성 엔벨로프와 사이클 인지 채널을 결합하여 한눈에 체제, 타이밍 및 위험을 보여주는 트렌드 트레이딩용 시각적 도구 키트입니다. 어떤 배경(밝음/어두움)에서도 읽기 쉽도록 설계되었으며, 화면을 깔끔하게 유지하면서도 “다음에 무엇을 해야 할지” 힌트를 제공합니다.
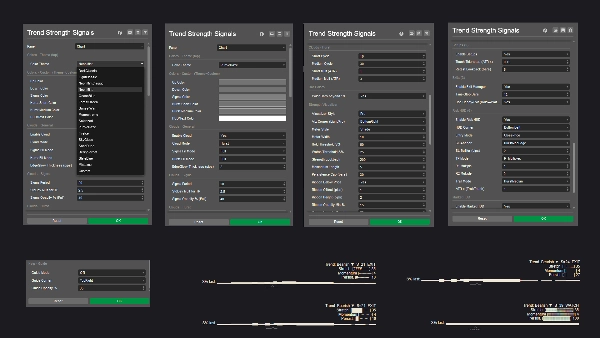
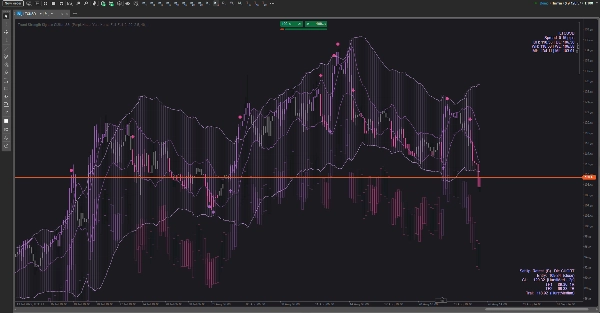
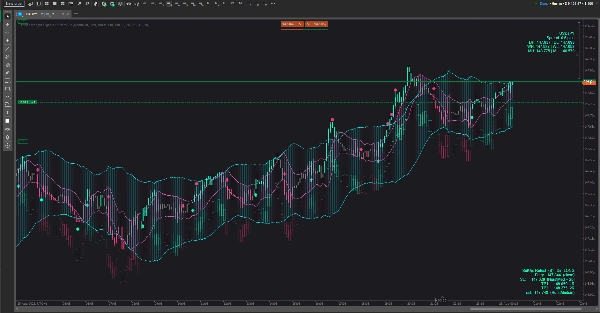
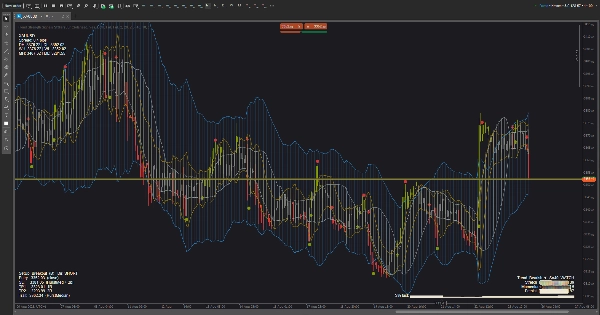
차트에서 보는 것
- 클라우드 (토글 가능):
-
- 시장 활동에 따라 확장/축소되는 변동성 클라우드.
- 가격의 주기적 리듬을 추적하는 사이클 클라우드.
- 하나만, 둘 다, 또는 모두 표시하지 않을 수 있습니다.
- 신호: 잠재적 트렌드 전환을 위한 눈에 거슬리지 않는 위/아래 화살표; 이익 실현을 위한 작은 점들.
- 트렌드 강도 HUD (세 가지 스타일):
-
- 라이트 — 컴팩트한 상태 태그.
- 프로 — 세 가지 미터(스트레치, 모멘텀, 지속성)와 미니 히스토리 스파크라인이 포함된 작은 대시보드.
- 리본 — 가격 근처에 부드러운 바가 있으며, 강도는 트렌드 강도를 따릅니다.
- 위험 HUD: 방향 제안, 보호용 스톱 영역, 두 단계의 이익 목표, 선택적 트레일링 아이디어를 제공합니다. 원하는 코너에 위치하며 바가 진행됨에 따라 업데이트됩니다.
- 시장 HUD: 심볼 및 스프레드, 일/주/월 최고-최저 참조를 포함하여 항상 더 큰 지도 내에서 자신의 위치를 알 수 있습니다.
- 테마: 밝고 어두운 차트용으로 엄선된 색상 세트(및 사용자 지정 모드). 모든 그래픽 요소—HUD 및 신호 포함—는 활성 테마를 따릅니다.
사용 방법 (실용적, 기술적이지 않음)
- 클라우드 뷰 선택:
-
- 압축과 확장을 보기 위해 변동성 클라우드를 사용하세요.
- “에지” 대 “중간” 회전을 판단하기 위해 사이클 클라우드를 사용하세요.
- 컨텍스트와 타이밍을 원하면 둘 다 사용하세요.
- 트렌드 강도 읽기:
-
- 상태가 HOLD로 상승하면 현재 방향에 맞춰 거래를 편향하고; WATCH로 떨어지면 공격성을 줄이며; EXIT가 표시되면 신규 거래를 피하거나 위험을 조절하세요.
- 프로 모드에서는 미터가 상승하고 스파크라인이 상승하면 품질이 개선됨을 의미하며, 미터가 감소하면 위험을 관리하세요.
- 가격과 클라우드로 진입 타이밍 맞추기:
-
- 압축 후 돌파, 클라우드로의 정중한 되돌림 후 재진입, 또는 외곽 가장자리에서의 반등이 기본 패턴입니다.
- 바 중간에 초기 화살표가 나타났다가 사라지면, 헤드 페이크를 줄이고 싶다면 바 마감 확인을 기다리세요.
- 위험 HUD로 거래 관리:
-
- HUD가 강조하는 가장 가까운 구조적 경계 너머에 보호용 스톱을 대략적으로 설정하세요.
- TP1에서 일부를 청산하고 나머지는 TP2를 목표로 하거나 제안된 트레일링 라인을 따르세요.
- 트렌드 강도가 강한 상태에서 약한 상태로 약해지면 조기 청산을 고려하세요.
- 상황별 필터:
-
- 클라우드가 얇고 불규칙하거나 강도 상태가 EXIT에 있을 때 진입을 피하세요.
- 강도가 상승하고 클라우드가 기울어지며 가격이 가장자리와 깔끔하게 상호작용할 때 거래를 선호하세요.
사용자 정의
- 작업 공간에 맞게 HUD 코너, 시각화 스타일 및 색상 테마를 전환하세요.
- 밝은 배경에서 텍스트가 잘 보이도록 밝은 테마를 유지하고, 오션/포레스트/선셋 팔레트는 눈부심 없이 미묘한 대비를 더합니다.
이것은 아닙니다
이것은 블랙박스 자동 거래기가 아닙니다. 의사결정 보조 도구로서 트렌드 품질을 프레임화하고, 합리적인 위험 위치를 제안하며, 높은 확률의 순간을 강조하지만, 사용자가 통제권을 유지합니다.
요약
지표 프로필
고객 리뷰
5.0
리뷰: 1
5 | 100 % | |
4 | 0 % | |
3 | 0 % | |
2 | 0 % | |
1 | 0 % |
고객 리뷰
September 2, 2025
The reason it feels usable is direction is easier to respect, and a 1R exit plan makes review easier.
상담
자주 묻는 질문(FAQ)
트레이딩 봇, 지표, 플러그인 등 cTrader Store에서 제공되는 상품은 제3자 개발자에 의해 제공되며, 이는 단순히 정보 및 기술적 접근을 목적으로 제공된 것입니다. cTrader Store는 중개인이 아니며, 투자 조언, 개인별 추천 또는 향후 성과에 대한 어떠한 보장도 제공하지 않습니다.


좋아하실 만한 다른 항목


가격
가입일 26/05/2025
385.09M
거래량
60.66K
핍 수익
14
판매
1.4K
무료 설치