
Side Volume Profile
지표
11 구매
버전 1.0, Aug 2025
Windows, Mac
4.3
리뷰: 3
설명
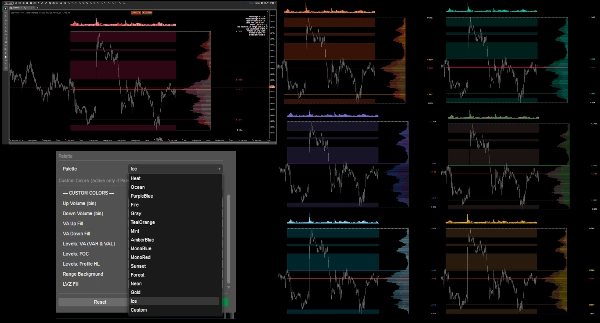
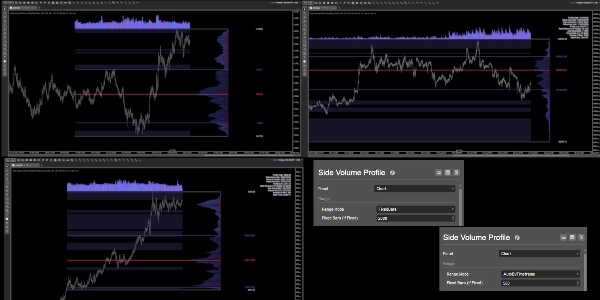
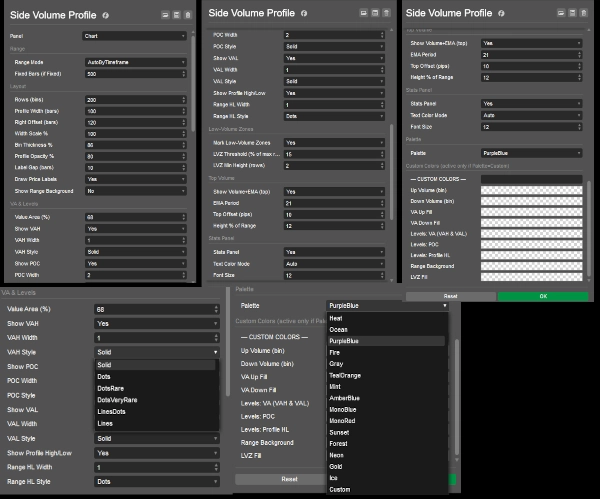
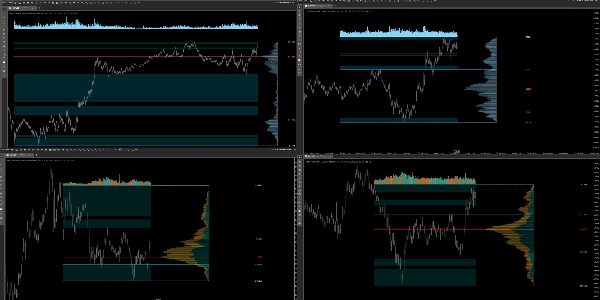
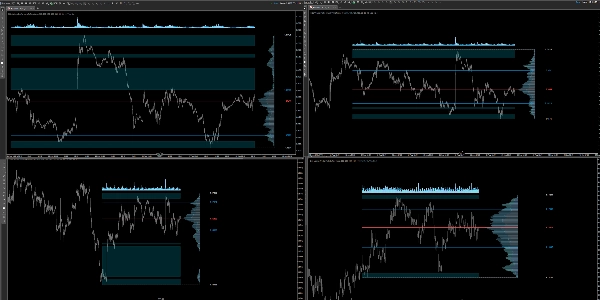
항상 마지막 바에 고정되어 차트를 이동할 때 점프하지 않는 오른쪽 볼륨 프로필입니다. 선택한 범위(시간 프레임별 자동 또는 고정 바 수) 내에서 가격별 볼륨을 계산하고, POC, VAH/VAL, 프로필 경계(고가/저가)를 표시하며, 저볼륨 영역(LVZ)을 강조하고, 범위 위에 EMA가 있는 볼륨 히스토그램(핍 단위 오프셋 포함)을 그립니다. 오른쪽 상단 통계 패널, 여러 고대비 팔레트 및 사용자 지정 색상, 전역 빈 불투명도, 너비/오프셋 제어, 각 라인 두께/스타일을 포함합니다. 가독성과 성능을 위해 설계되었습니다.
- 범위: 시간 프레임별 자동 또는 고정 바.
- 레이아웃: 행(빈), 프로필 너비 / 너비 비율, 오른쪽 오프셋, 빈 두께, 라벨 간격, 프로필 불투명도; 선택적 범위 배경.
- VA 및 레벨: 가치 영역 %, VAH/POC/VAL 전환, 레벨별 선 너비 및 스타일; 프로필 고가/저가.
- 저볼륨 영역: 임계값(최대 행의 %) 및 최소 높이(행 수).
- 상위 볼륨: EMA 기간, 높이(범위의 %), 기본 오프셋 10핍.
- 팔레트/사용자 지정: 테마 선택 또는 직접 색상 설정(VAH = VAL).
- 통계 패널: 전환, 글꼴 크기
지표 문서입니다
요약
AI 요약
Side Volume Profile is a right-anchored volume profile indicator designed for cTrader that displays volume-by-price data over a selectable range, either automatically by timeframe or a fixed number of bars. It visualizes key volume levels including Point of Control (POC), Value Area High (VAH), Value Area Low (VAL), and profile bounds (high/low). The indicator highlights low-volume zones (LVZ) based on configurable thresholds and minimum heights. It also features a volume histogram with an exponential moving average (EMA) offset in pips above the profile range.
Users can customize the layout with controls for row bins, profile width and scale, right offset, bin thickness, label gaps, and opacity. Line widths and styles for VAH, POC, VAL, and profile bounds are adjustable. Multiple high-contrast color palettes and custom color options are available. A toggleable top-right statistics panel provides summary data with adjustable font size.
The indicator supports various markets including Forex, indices, commodities, cryptocurrencies, and stocks, with tags referencing symbols like BTCUSD, EURUSD, GBPUSD, XAUUSD, NAS100, and USDJPY. It is built for readability and performance, maintaining a stable position on the chart without shifting when panning.
지표 프로필
고객 리뷰
4.3
리뷰: 3
5 | 33 % | |
4 | 67 % | |
3 | 0 % | |
2 | 0 % | |
1 | 0 % |
상담
자주 묻는 질문(FAQ)
BTCUSD
Forex
Indices
EURUSD
Commodities
GBPUSD
NZDUSD
Prop
Fair Value Gap
SMC
Crypto
Stocks
XAUUSD
NAS100
USDJPY
VWAP
트레이딩 봇, 지표, 플러그인 등 cTrader Store에서 제공되는 상품은 제3자 개발자에 의해 제공되며, 이는 단순히 정보 및 기술적 접근을 목적으로 제공된 것입니다. cTrader Store는 중개인이 아니며, 투자 조언, 개인별 추천 또는 향후 성과에 대한 어떠한 보장도 제공하지 않습니다.


가격
가입일 26/05/2025
385.04M
거래량
60.66K
핍 수익
14
판매
1.4K
무료 설치