설명
SmartFractalZigZag Plus — 스마트 프랙탈, 지그재그, 자동 피보나치 및 동적 지지/저항 구역
════════════════════════════════════════════════════════════════════════════════
제품 개요
SmartFractalZigZag Plus는 KDE, HTF 합류 및 SR 트렌드 바이어스 패널과 함께 정량적 지지/저항 구역을 제공하며, 지지/저항 구역 내 자동 피보나치 보강 기능을 포함합니다.
SmartFractalZigZag Plus는 cTrader용 SmartFractalZigZag 제품군의 기관급 에디션입니다.
역사적으로 안정적인 프랙탈 엔진, 깔끔한 지그재그 스윙, Pro 버전의 완전 자동 피보나치 되돌림/확장 기능과 동적 지지 및 저항 구역 엔진, 다중 타임프레임 합류 감지 및 강세/약세 트렌드 바이어스 패널을 결합합니다.
내부적으로 Plus는 단순한 "터치 횟수 세기" 지표가 아닌 정량적 지지/저항 모델로 구축되었습니다. 구조적으로 유효한 프랙탈 피벗, ATR 정규화 거리, 로짓 공간 증거 집계 및 지수 시간 감쇠를 사용하여 원시 가격 움직임을 각 구역에 대한 안정적인 확률 유사 강도 점수로 변환합니다.
Plus는 가격이 어디에서 반전되었는지뿐만 아니라 각 구역이 얼마나 강한지, 테스트에 어떻게 반응하는지, 그리고 상위 타임프레임 구조가 현재 차트를 어떻게 조용히 보강하는지를 보고자 하는 트레이더를 위해 설계되었습니다. 이 설계는 SMC/ICT, Wyckoff, Dow 이론, Chan 이론 및 고전 피보나치 트레이딩의 아이디어를 바탕으로 단일하고 일관된 엔진으로 정제되었습니다.
════════════════════════════════════════════════════════════════════════════════
기능 비교 (Pro vs Plus)
Pro와 Plus 모두 포함:
• 스마트 프랙탈 감지 및 동일 방향 필터링
• 지그재그 스윙 연결
• 실시간 자동 피보나치
Plus 전용 기능:
• 동적 지지/저항 구역 (KDE 밀도 히트맵)
• HTF 지지/저항 합류
• SR 트렌드 바이어스 (강세/약세 지수 + 패널)
════════════════════════════════════════════════════════════════════════════════
핵심 구조 기능 (에디션 간 공통)
────────────────────────────────────────────────────────────────────────────────
1. 스마트 프랙탈 감지
프랙탈은 시장 구조 분석의 기초로, 지역 가격 극값(스윙 고점 및 저점)을 식별합니다.
SmartFractalZigZag는 조정 가능한 민감도의 역사적으로 안정적인 프랙탈 엔진을 사용하여 스캘핑, 일중, 스윙 또는 포지션 트레이딩에 맞게 감지를 조정할 수 있습니다. Left Bars 및 Right Bars 매개변수는 전체 전략 논리를 변경하지 않고도 엔진의 선택성을 조절할 수 있습니다.
거래 스타일별 권장 설정:
• 스캘핑: Left 3 / Right 2
• 일중: Left 5 / Right 3
• 스윙: Left 10 / Right 5
• 포지션: Left 20 / Right 10
────────────────────────────────────────────────────────────────────────────────
2. 스마트 동일 방향 필터링
여러 연속된 프랙탈이 동일 방향으로 나타날 때, 지표는 진정한 극값(상향 프랙탈의 최고 고점, 하향 프랙탈의 최저 저점)만 유지합니다.
이는 깔끔한 고점-저점-고점-저점 순서를 강제하며 구조를 쉽게 읽을 수 있게 합니다. 가장 최근의 오른쪽 프랙탈만이 새 바가 닫힐 때 조정될 수 있으며, 과거 구조는 다시 그려지지 않습니다.
────────────────────────────────────────────────────────────────────────────────
3. 지그재그 스윙
필터링된 프랙탈 포인트들은 지그재그 스윙으로 연결되어, 한눈에 트렌드 방향과 스윙 경계를 명확히 보여줍니다.
────────────────────────────────────────────────────────────────────────────────
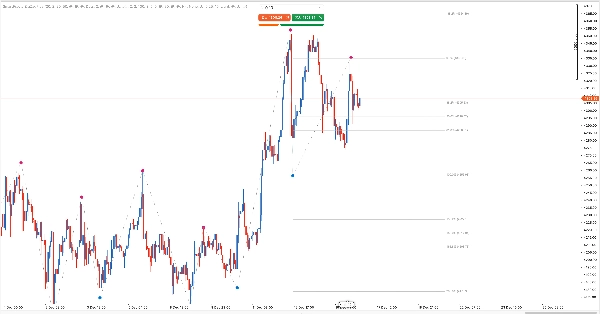
4. 실시간 자동 피보나치
가장 최근 스윙을 기반으로 피보나치 되돌림 및 확장 레벨을 자동으로 그립니다:
• 자동 앵커 – 항상 확인된 구조적 고점/저점에 연결됨
• 동적 업데이트 – 새로운 구조가 형성됨에 따라 레벨이 실시간으로 조정됨
• 일반적으로 사용되는 되돌림 및 확장 레벨 전체 세트 (추세 지속을 위한 음수 확장 포함), 모두 개별 설정 가능
• 깔끔한 시각적 규칙: Fib 레벨 가격이 Plus 지지/저항 구역 내에 있을 때, Fib 라벨은 추가 도형을 그리는 대신 [SR] 접두사와 함께 굵게 표시됩니다. 이는 차트를 복잡하게 하지 않고 "강한 지지/저항 구역 내 피보나치"를 쉽게 식별할 수 있게 하며, Pro 에디션 대비 주요 업그레이드 중 하나입니다.
────────────────────────────────────────────────────────────────────────────────
5. 테마 지원
차트 배경에 자동으로 맞춰지는 내장 라이트/다크 테마 지원. 모든 선, 구역 및 라벨은 두 테마 모두에서 가독성을 위해 조정되었습니다.
════════════════════════════════════════════════════════════════════════════════
Plus 전용 지지/저항 및 합류 엔진
────────────────────────────────────────────────────────────────────────────────
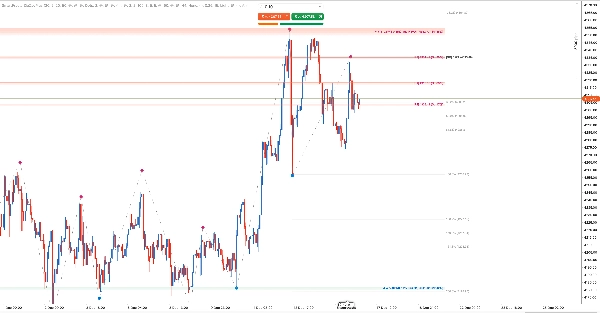
6. 동적 지지/저항 구역 (KDE 밀도 히트맵)
Plus는 프랙탈 구조 위에 완전한 동적 지지/저항 구역 엔진을 도입합니다:
• 프랙탈 기반 지지/저항 피벗 – 구역은 전용 지지/저항 프랙탈에서 구축되며, 메인 표시 프랙탈과 독립적이지만 동일한 역사 안정 규칙을 따릅니다
• 프랙탈 수에 따른 고정 창 – 단일 프랙탈 창 크기 매개변수(예: 100)를 설정합니다. 엔진은 항상 최근 N개의 지지/저항 프랙탈을 사용하며, 이들이 차지하는 바 수와 무관합니다
• 시간 가중 및 스윙 가중 밀도 – 각 지지/저항 프랙탈은 최신성, 스윙 크기 및 가격 위치를 기반으로 커널 밀도 추정에 기여합니다
• 자동 대역폭 (추가 입력 없음) – 구역 너비는 프랙탈 간격과 ATR에서 도출되며, 견고한 범위로 제한됩니다
• 히트맵 시각화 – 구역은 밀도 기반 불투명도를 가진 다층 직사각형으로 그려져 강한 구역이 시각적으로 더 두껍고 밝게 나타납니다
• 측면별 최대 구역 – 최대 저항 구역 및 최대 지지 구역은 강도 순위를 자연스러운 필터로 사용하여 표시되는 구역 수를 제한합니다
이 지지/저항 엔진이 전통적인 레벨과 다른 점
대부분의 지지/저항 도구는 눈대중으로 고점/저점을 기반으로 몇 개의 수평선을 그리거나, 가격이 단순 가격 레벨을 터치한 횟수를 셉니다.
Plus는 매우 다른 정량적 접근 방식을 취합니다:
• 프랙탈 고정, 임의가 아님 – 모든 구역은 단일 바의 꼬리가 아닌 구조적으로 유효한 프랙탈 피벗에서 파생됩니다
• 구역, 얇은 선이 아님 – KDE는 거래가 실제로 집중된 가격 밴드를 완전하게 구축하며, 단일 정확한 틱이 아닙니다
• 강도는 확률 유사, 단순 터치 횟수가 아님 – 각 반응은 밴드 높이와 ATR로 정규화되고, 시간이 지남에 따라 EffectiveStrength로 결합됩니다
• 수명 주기 인식 – 빠른 스윕, 깔끔한 돌파 및 반복적이고 간격을 둔 재테스트는 매우 다르게 처리됩니다; "깨지고 무시된" 레벨은 자연스럽게 강도가 감소합니다
• 역사에서 안정적 – 구역이 형성되고 확인되면 위치가 안정적이며, 앞으로는 새로운 반응과 HTF 증거만이 강도를 업데이트할 수 있습니다 (과거 반응의 역사적 재도색 없음)
결과적으로 이 S/R 맵은 고전적인 "선을 그리고 터치를 세는" 지표보다 기관에서 사용하는 공급/수요 구역의 행동에 훨씬 가깝습니다.
────────────────────────────────────────────────────────────────────────────────
7. 반응 인식 구역 수명 주기
모든 레벨의 터치가 동일하지 않습니다. Plus는 각 지지/저항 구역의 수명 주기를 모델링합니다:
• 상태 – 활성, 테스트 중, 깨짐
• 테스트 유형 – 엔진은 밴드를 넘어선 여러 종가를 가진 깔끔한 돌파와 강한 반전과 함께 빠르게 다시 진입하는 엄격한 스윕, 그리고 비파괴 재테스트(터치/내부 및 터치 없이 접근 거부)를 구분합니다
• 반응 점수 – 각 테스트 창에서 가격 움직임은 밴드 높이와 ATR에 상대적으로 정규화되어 측정되며, 창 내에서 끝 가중치가 적용된 반응 점수 ∈ [-1, 1]로 변환됩니다
• 테스트 점수 – 반복적이고 간격을 둔 성공적인 테스트는 별도의 테스트 점수 차원을 증가시킵니다
• 유효 강도 – 반응 점수와 테스트 점수는 기본 구조 강도와 로짓 공간에서 결합되어 각 구역에 대해 안정적인 유효 강도를 얻습니다
결과적으로 이 구역 엔진은 "과거에 이 레벨이 얼마나 잘 유지되었는가?"에 답할 수 있으며, 단순히 "가격이 몇 번 터치했는가?"만을 묻는 것이 아닙니다.
────────────────────────────────────────────────────────────────────────────────
8. 다중 타임프레임 지지/저항 합류
Plus는 상위 타임프레임(HTF)에서 지지/저항 구역을 자동으로 계산하고 현재 차트에 그 영향을 투영합니다:
• 최대 3개의 HTF 선택 – 인터랙티브 패널 버튼을 통해 M30, H1, H4, D1, W1, MN1 조합 선택 가능
• HTF 선택 지속성 – 동일 차트 창에서 타임프레임 전환 시 선택이 유지됨
• 구성 가능한 1차/2차/3차 HTF (또는 현재 타임프레임 기반 자동 매핑)
• 표준 및 비표준 TF(M2, H2 등)와 작동하는 견고한 타임프레임 순위
• 현재 및 HTF 대역폭을 기반으로 한 적응형 중첩 허용 오차
• 구역별 HTF 합류 메타데이터 저장: HtfTag (예: H4, H4+D1) 및 ConfluenceTFCount
• 삼각형 접두사 – HTF 합류가 있는 구역의 라벨 텍스트는 1~3개의 삼각형(▲/▼)으로 시작하며, 합류된 HTF 수와 수정된 강도 라벨을 표시
예: ▲▲ Corr Str 82% [S5 H4+D1] (Str:76%)
여기서 Corr Str 82%는 HTF 보정 강도이며, Str:76%는 현재 타임프레임의 원시 EffectiveStrength입니다.
────────────────────────────────────────────────────────────────────────────────
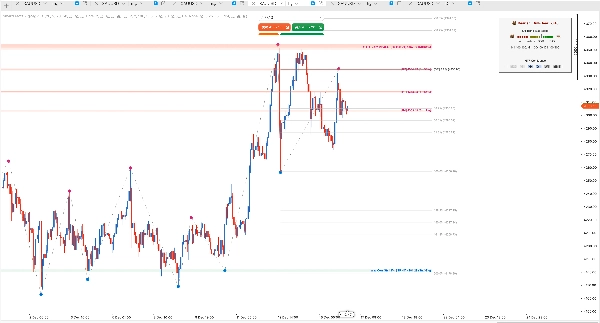
9. SR 트렌드 바이어스 (강세/약세 지수) 패널
컴팩트한 SR 트렌드 바이어스 패널은 현재 가격 주변의 순 지지 대 저항 강도를 요약합니다:
• 최소화/확장 토글 – 필요하지 않을 때 패널을 축소; 상태는 세션 간 유지
• HTF 리셋 버튼 – 현재 타임프레임 기반 자동 매핑 기본값으로 HTF 선택 복원
• 인근 구역의 EffectiveStrength를 가중치로 사용
• [-1, 1] 범위의 바이어스 지수를 출력하며, 균형, 약간 강세, 강세, 강한 강세, 강한 약세 등 직관적인 라벨에 매핑
• 곰/황소 아이콘과 색상 코딩된 구간이 포함된 시각적 스케일로 빠른 판독 가능
• 데이터가 부족할 때 명확히 표시 (예: 아직 충분한 지지/저항 프랙탈이 없거나 유효 구역 기여가 없음)
• 지지 또는 저항만 유효하게 존재해도 지수는 계산됨 (자연스럽게 +1 또는 -1에 접근)
────────────────────────────────────────────────────────────────────────────────
10. 자동 이력 백필 및 안정성
지지/저항 구역과 HTF 합류가 의미 있도록, 지표는 자동으로 이력 로딩을 관리합니다:
• 현재/HTF 프랙탈 수가 프랙탈 창 크기 미만일 때 추가 이력 요청
• 과도한 플랫폼 부하를 방지하기 위해 심볼/TF별 로드 상태를 조절 및 백오프하며 추적
• HistoryLoaded/Reloaded 이벤트 처리 및 바 이동 시 내부 상태 완전 재구성
• SR 바이어스 패널을 각 타임프레임의 실제 데이터 가용성과 동기화 유지
────────────────────────────────────────────────────────────────────────────────
11. 내부 구조: 정량적 엔진
Plus의 지지/저항 엔진은 의도적으로 수학적으로 무거워서 시각적 출력이 심볼, 타임프레임 및 확대 수준에 걸쳐 일관되게 유지됩니다:
• ATR 정규화 대역폭을 가진 프랙탈 피벗에 대한 커널 밀도 추정(KDE)으로 임의 가격 레벨이 아닌 실제 공급/수요 클러스터를 찾음
• Str%에 대한 고정 정규화 기준으로, "강한" 구역은 확대/축소 여부와 관계없이 동일한 의미를 가짐
• 로짓 공간 증거 융합 – BaseStrength, ReactionScore, TestScore 및 HTF 증거는 임의 점수가 아닌 로지스틱 변환을 사용해 결합됩니다. 이는 강도 척도를 부드럽고 제한된 상태로 유지합니다
• 지수 시간 감쇠 및 간격 제어 – 오래된 반응과 밀집된 테스트는 반감기 스타일 공식으로 자동으로 가중치가 낮아집니다
• 안정적인 역사 설계 – 스윙 또는 구역이 확인되면 위치와 Str%가 안정적이며, 가장 새로운 증거만이 수정된 강도를 기울일 수 있습니다
════════════════════════════════════════════════════════════════════════════════
누구를 위한 것인가?
• 깔끔하고 역사적으로 일관된 구조와 동적 지지/저항 히트맵을 원하는 일중 및 스윙 트레이더
• OTE 구역과 주변 지지/저항의 강한 또는 약한 반응 이력을 중요시하는 SMC/ICT 트레이더
• 자동 피보나치 및 지지/저항 컨텍스트를 단일 화면에서 원하는 재량적 트레이더
• 상위 타임프레임 레벨에 의존하며 이를 활성 차트에 명확히 표시하고자 하는 다중 타임프레임 트레이더
════════════════════════════════════════════════════════════════════════════════
왜 SmartFractalZigZag Plus인가?
문제: 수평선이 임의적이고 주관적으로 느껴짐
해결책: 엄격한 프랙탈 + KDE 밀도 알고리즘과 명확한 규칙으로 구역 생성
문제: 레벨이 강한지 약한지 알 수 없음
해결책: 반응 인식 수명 주기와 EffectiveStrength가 구조적 중요성과 가격의 레벨 주변 행동을 정량화
문제: HTF 레벨을 기억하기 어려움
해결책: 자동 HTF 지지/저항 합류 및 모든 구역 라벨에 명확한 HtfTag + 삼각형 접두사
문제: 너무 많은 개별 도구가 차트를 복잡하게 만듦
해결책: 하나의 지표가 프랙탈 + 지그재그 + 피보나치 + 동적 지지/저항 + HTF 합류 + 바이어스 패널을 결합
문제: 이력 백필 동작이 예측 불가능
해결책: 데이터가 아직 다운로드 중이거나 소진되었을 때 UI 피드백과 함께 명시적 이력 로드 관리
════════════════════════════════════════════════════════════════════════════════
모든 방법론과 호환
• SMC / ICT – BOS, CHoCH, 스윙 포인트, OTE 구역, 반응 인식 지지/저항 및 유동성 스윕
• 엘리엇 파동 – 스윙 피벗, 피보나치 확장 및 동적 지지/저항 구역과의 합류
• 다우 이론 – 시각적으로 명확한 지그재그 스윙과 함께 고점 상승 / 저점 하락
• 와이코프 – 공급/수요 구역, 스프링, 업스트러스트 및 그 반응 품질
• 찬 이론 – 펜, 세그먼트 및 구조적 피벗 정렬
• 피보나치 – 자동으로 그려진 레벨과 구역 인식 [SR] 합류 태그
════════════════════════════════════════════════════════════════════════════════
매개변수 (Plus 하이라이트)
아래는 가장 중요한 매개변수 그룹의 개요입니다. 전체 기술 세부사항은 첨부 문서를 참조하십시오.
────────────────────────────────────────────────────────────────────────────────
1. 프랙탈 설정
• Left Bars – 비교를 위한 왼쪽 바 수 (기본값: 20)
• Right Bars – 확인을 위한 오른쪽 바 수 (기본값: 2)
프랙탈 표시:
• 상승 프랙탈 색상 – 기본값: DeepPink
• 하락 프랙탈 색상 – 기본값: DodgerBlue
• 프랙탈 크기 – 기본값: 20
• 프랙탈 오프셋 (포인트) – 기본값: 50
• 프랙탈 표시 여부 – 기본값: 켬
필터 설정:
• 연속 필터 – 지그재그 및 피보나치에 필요한 스마트 동일 방향 필터링 (기본값: 켬)
────────────────────────────────────────────────────────────────────────────────
2. 지그재그 설정
• 지그재그 활성화 – 기본값: 켬
• 지그재그 색상 – 기본값: 회색
• 지그재그 스타일 – 기본값: 점
• 지그재그 두께 – 기본값: 2
────────────────────────────────────────────────────────────────────────────────
3. 피보나치 설정
• 피보나치 활성화 – 마스터 스위치 (기본값: 켬)
• 라벨 표시 – 가격 라벨 표시 (기본값: 켬)
• 레벨 스위치 – -100%에서 200%까지 19개의 개별 스위치 (핵심 레벨 기본 켬)
참고: RightOffset은 현재 보이는 차트 너비(뷰포트)의 백분율로 해석되며 안전 범위(1%-500%)로 제한됩니다. 이는 Fib 선/라벨과 지지/저항 구역/라벨의 공유 오른쪽 가장자리를 제어합니다.
────────────────────────────────────────────────────────────────────────────────
4. 지지/저항 구역 설정 (Plus)
• 지지/저항 구역 활성화 – 동적 지지/저항 엔진의 마스터 스위치 (기본값: 켬)
• 구역 피벗 왼쪽 바 – 기본값: 2
• 구역 피벗 오른쪽 바 – 기본값: 2
• 프랙탈 창 크기 – 사용되는 최근 지지/저항 프랙탈 수 (기본값: 100)
• 거리 스케일 (ATR 배수) – 기본값: 5.0
• 최대 저항 구역 – 기본값: 5
• 최대 지지 구역 – 기본값: 5
• 구역 라벨 표시 – 기본값: 켬
• 최대 불투명도 % – 기본값: 90
• 저항 색상 – 기본값: 토마토
• 지지 색상 – 기본값: 미디엄시그린
────────────────────────────────────────────────────────────────────────────────
5. HTF 지지/저항 합류
• HTF 합류 사용 – 다중 TF 지지/저항 합류 활성화 (기본값: 켬)
• 자동 HTF 매핑 – 현재 TF 기반 자동 HTF 선택 (기본값: 켬)
• 1차 HTF – 기본값: H4
• 2차 HTF – 기본값: 없음
• 3차 HTF – 기본값: 없음
────────────────────────────────────────────────────────────────────────────────
6. SR 트렌드 바이어스 (강세/약세 지수)
• SR 트렌드 바이어스 활성화 – 기본값: 켬
• 트렌드 바이어스 임계값 – 균형 대 강세/약세 바이어스 임계값 (기본값: 0.25)
────────────────────────────────────────────────────────────────────────────────
7. 표시 및 테마 설정
• 오른쪽 오프셋 (%) – 보이는 차트 너비의 %로 오른쪽 예약 (기본값: 30)
• 색상 테마 – 라이트 / 다크 (기본값: 라이트)
• 테마 팔레트 사용 – 기본값: 켬
────────────────────────────────────────────────────────────────────────────────
8. 기타 설정
• 모든 인스턴스 강제 정리 – 기본값: 끔
• 이력 로드 디버그 – 기본값: 끔
════════════════════════════════════════════════════════════════════════════════
업그레이드 경로
현재 SmartFractalZigZag Pro를 사용 중이며 다음을 원한다면:
• KDE 밀도 히트맵이 포함된 동적이고 반응 인식 지지/저항 구역
• 자동 다중 타임프레임 지지/저항 합류 및 명확한 시각적 삼각형
• 실제 지지/저항 강도로 구축된 통합 강세/약세 트렌드 바이어스 패널
그렇다면 SmartFractalZigZag Plus가 자연스러운 업그레이드입니다 — 동일한 기본 엔진을 전체 구조 + 수학 + 동적 지지/저항 + HTF 합류 워크플로우로 확장합니다.
════════════════════════════════════════════════════════════════════════════════
중요 참고 사항
설계상 안정적인 역사
이 지표는 확인된 스윙과 지지/저항 구역을 역사에서 안정적으로 유지하면서도 활성 구간/구역이 새로운 가격 움직임에 반응할 수 있도록 구축되었습니다. 구조가 확인되면 앵커 포인트가 고정되며, 시장이 진화함에 따라 아직 형성 중인 구간과 최신 구역만 적응할 수 있습니다.
스위치 의존성
지그재그와 피보나치는 모두 연속 필터 = 켬이 필요합니다. 이를 끄면 원시 프랙탈 포인트만 표시되고 지그재그/피보나치는 비활성화됩니다. 지지/저항 구역은 항상 자체 전용 프랙탈 엔진을 사용하며 동일 방향 필터링이 적용됩니다.
데이터 충분성
지지/저항 구역과 HTF 합류는 현재 및 선택된 HTF 타임프레임에서 최소한 프랙탈 창 크기만큼의 지지/저항 프랙탈을 필요로 합니다. 데이터가 아직 로드 중이거나 부족할 때 바이어스 패널이 이 상태를 명확히 표시합니다.
체험판
cTrader 스토어를 통해 체험판이 제공될 수 있으므로 구매 전에 자신의 심볼과 타임프레임에서 지표를 테스트할 수 있습니다.
════════════════════════════════════════════════════════════════════════════════
지원
질문이나 피드백이 있으시면 cTrader 스토어를 통해 문의해 주십시오.
SmartFractalZigZag Plus를 선택해 주셔서 감사합니다!