
설명
HIO Inside Bar Scanner Free: cTrader에서 사용할 수 있는 궁극의 무료 인사이드 바 헌터!
1. 소개 체계적인 가격 행동 트레이딩의 힘을 비용 없이 경험하고 싶으신가요? HIOInsideBarScanner Free는 여러분을 위한 완벽한 다중 타임프레임 스캐닝 엔진입니다! cTrader에 최적화된 이 도구는 활성 차트에서 고확률 인사이드 바 설정을 자동으로 감지하여 중요한 시장 돌파를 절대 놓치지 않도록 보장합니다.
2. 주요 기능
- 다중 타임프레임 대시보드: 단일의 컴팩트한 그리드를 통해 현재 심볼의 가격 움직임을 여러 타임프레임(예: M15, H1, D1)에서 동시에 모니터링합니다.
- 정확한 돌파 감지: 가격이 인사이드 바 또는 마더 바를 돌파할 때 매우 정확한 가짜 돌파(트랩) 감지와 함께 로그 알림을 받습니다.
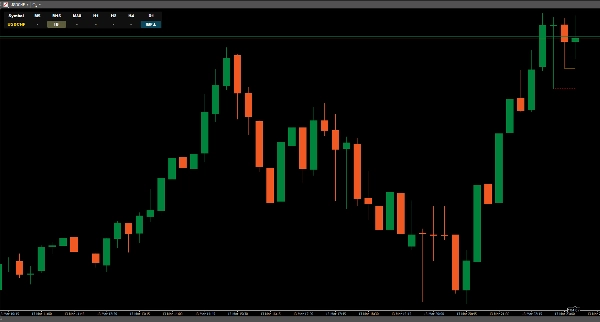
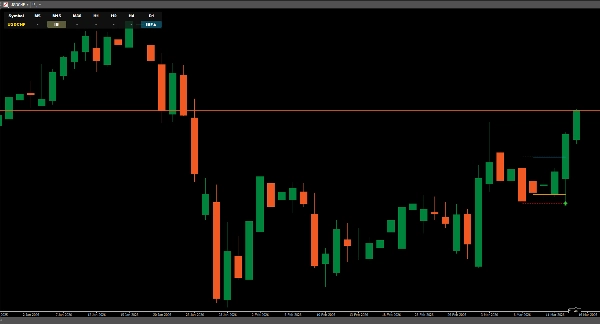
- 자동 시각화: 마더 바(MB)와 인사이드 바(IB)의 경계선을 명확하게 자동으로 그리며, 주요 차트에 방향 신호 화살표도 표시합니다.
3. 설정 가이드 및 매개변수 설명
무료 버전임에도 불구하고 이 인디케이터는 고급 필터링 로직을 100% 유지하여 전략에 맞게 조정할 수 있습니다:
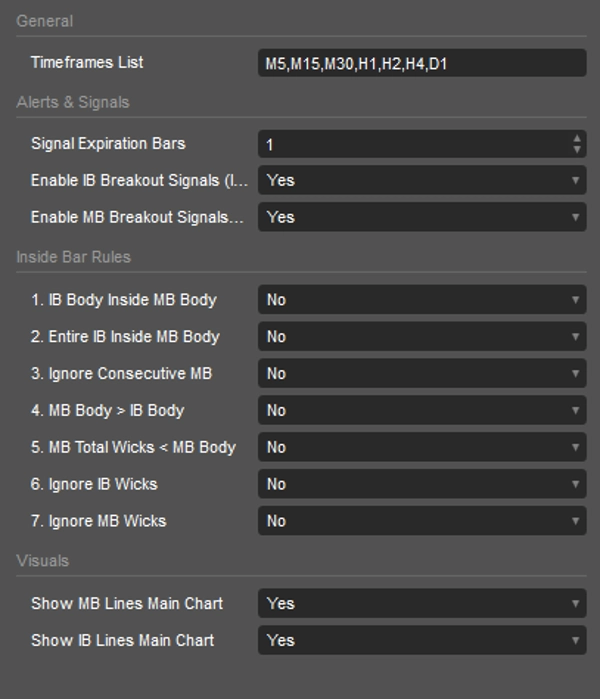
- 일반 설정:
-
- 타임프레임 목록: 현재 차트에서 스캔할 선호하는 타임프레임을 입력하여 접근 방식을 정의합니다(예: H1, H4, D1).
- 알림 및 신호:
-
- 신호 만료 바: 돌파 신호가 유효한 바의 수를 정의합니다. 모멘텀이 약해질 때 늦은 진입을 방지하세요!
- IB 돌파 신호 활성화 (IBI/IBIF): 가격이 인사이드 바 경계를 돌파할 때 알림을 받도록 토글하세요(가짜 돌파 감지 포함).
- MB 돌파 신호 활성화 (IB/IBF): 진정한 마더 바 돌파에 대한 알림을 활성화하여 강력한 추세 방향 확인을 제공합니다.
- 스마트 인사이드 바 규칙:
-
- IB 몸통이 MB 몸통 안에 있음: 인사이드 바의 몸통이 마더 바의 몸통 안에 완전히 포함되어야 하는 엄격한 필터입니다.
- 전체 IB가 MB 몸통 안에 있음: 인사이드 바 전체(윅 포함)가 마더 바의 몸통 안에 완전히 들어가야 합니다.
- 연속 MB 무시: 연속된 마더 바를 건너뛰어 새로운 설정에만 집중합니다.
- MB 몸통 > IB 몸통: 마더 바의 몸통이 인사이드 바 몸통보다 커야 합니다.
- MB 전체 윅 < MB 몸통: 전체 윅 크기가 몸통보다 작아야 하여 복잡한 마더 바를 걸러냅니다.
- IB/MB 윅 무시: 스캐너가 캔들 오픈/클로즈 가격만으로 돌파를 계산하도록 강제합니다.
- 시각화:
-
- 메인 차트에 MB/IB 선 표시: MB와 IB에 대해 깨끗하고 색상 구분된 경계선을 차트에 자동으로 그립니다.
4. 대시보드 심볼 가이드: 한눈에 시장 읽기 대시보드는 직관적이고 색상으로 구분된 심볼을 사용하여 현재 가격 움직임을 즉시 파악할 수 있도록 도와줍니다 :
- IB: 새로운 인사이드 바가 형성되었습니다. (준비하세요!)
- IBI▲: 가격이 인사이드 바의 고가 위에서 마감되었습니다.
- IBI▼: 가격이 인사이드 바의 저가 아래에서 마감되었습니다.
- IBIF▲: 가격이 마더 바의 저가 아래로 돌파한 후 인사이드 바의 고가 위에서 반전하여 마감되었습니다. (약세 가짜 돌파)
- IBIF▼: 가격이 마더 바의 고가 위로 돌파한 후 인사이드 바의 저가 아래에서 반전하여 마감되었습니다. (강세 가짜 돌파)
- IB▲: 가격이 마더 바의 고가 위에서 마감되었습니다. (강력한 강세 돌파)
- IB▼: 가격이 마더 바의 저가 아래에서 마감되었습니다. (강력한 약세 돌파)
- IBF▲: 가격이 마더 바의 저가 아래로 돌파한 후 급격히 반전하여 마더 바의 고가 위에서 마감되었습니다. (대규모 약세 함정)
- IBF▼: 가격이 마더 바의 고가 위로 돌파한 후 급격히 반전하여 마더 바의 저가 아래에서 마감되었습니다. (대규모 강세 함정)
요약
지표 프로필
고객 리뷰
0.0
리뷰: 0
고객 리뷰
이 상품에 대한 리뷰가 아직 없습니다. 이미 사용해 보셨나요? 다른 사람들에게 가장 먼저 소개해 주세요!
상담
자주 묻는 질문(FAQ)
BTCUSD
Forex
Signal
Breakout
Indices
EURUSD
Commodities
GBPUSD
NZDUSD
Prop
Scalping
Crypto
Stocks
XAUUSD
NAS100
USDJPY
트레이딩 봇, 지표, 플러그인 등 cTrader Store에서 제공되는 상품은 제3자 개발자에 의해 제공되며, 이는 단순히 정보 및 기술적 접근을 목적으로 제공된 것입니다. cTrader Store는 중개인이 아니며, 투자 조언, 개인별 추천 또는 향후 성과에 대한 어떠한 보장도 제공하지 않습니다.
이 작성자의 상품 더 보기


가격
가입일 12/06/2025
1
판매
330
무료 설치