
설명
QX SmartStructure (QX SS)
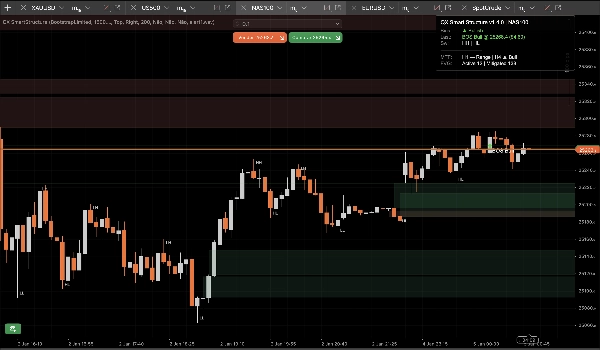
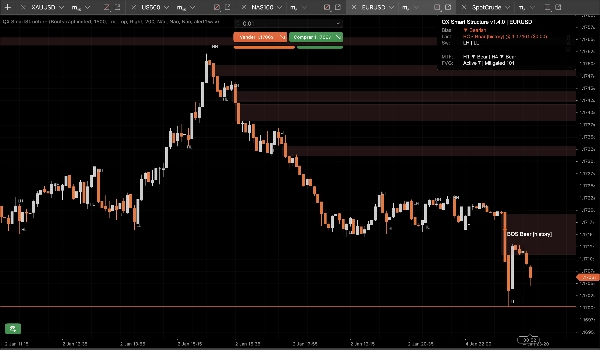
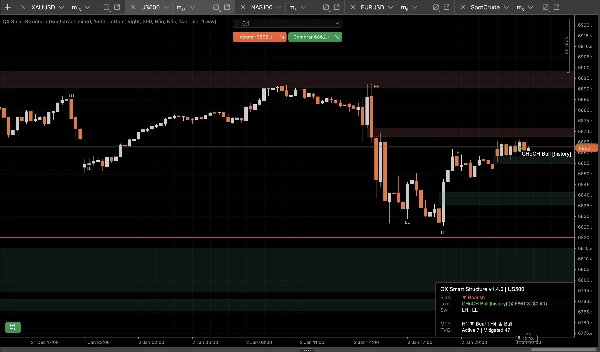
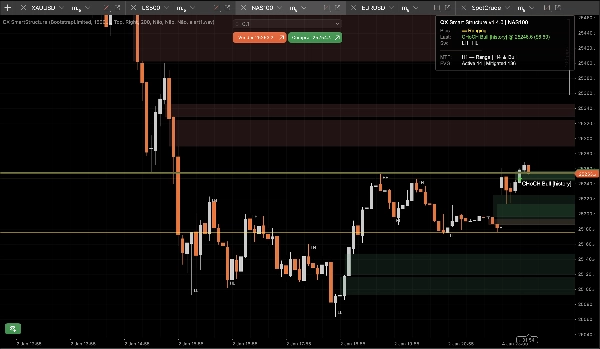
QX SmartStructure (QX SS)는 cTrader용 경량 하드-라이트-엣지 SMC 오버레이입니다. 현재 구조, BOS/CHoCH 돌파, 필터링된 + 자동 관리되는 FVG 영역, 그리고 시간 프레임 전환을 멈추게 하는 컴팩트한 H1/H4 MTF 바이어스 패널을 보여줍니다.
시각화 도구일 뿐입니다. 거래를 실행하지 않습니다.
표시 내용
1) 깨끗한 시장 구조 (하드-라이트-엣지)
- 스윙 라벨: HH / HL / LH / LL
- 주요 레벨: 마지막 확인된 스윙 고점 및 마지막 확인된 스윙 저점
- 돌파 이벤트: BOS / CHoCH 강도와 함께 (강함 대 약함)
- 표시 모드:
-
- ActiveOnly (최소한)
- RecentSwings (제어된 컨텍스트)
2) 제어되는 FVG 영역
- 강세 및 약세 FVG 사각형
- 최소 FVG 크기 (스텝) 필터가 마이크로 갭을 자동으로 제거합니다
- 50% 완화 규칙 (윅 기반): 가격이 영역의 절반 수준에 도달하면 영역이 완화됩니다
- 수명 주기:
-
- 자동 숨김 완화 = 켬 가장 깨끗한 차트를 위해
- 끔 완화된 영역을 “유령” 컨텍스트(낮은 불투명도)로 유지
- 하드 캡은 긴 세션 동안 객체 스팸을 방지합니다 (저장/그리기/우측 확장)
3) MTF 바이어스 패널 (H1 / H4)
컴팩트한 패널이 표시합니다:
- 현재 시간 프레임 바이어스: 강세 / 약세 / 횡보 / 알 수 없음
- 마지막 이벤트: BOS/CHoCH, 방향, 강도
- 선택적 스냅샷: H1 바이어스 및 H4 바이어스
4) 선택적 사운드 알림
돌파에 대한 사운드 전용 알림, 다음과 함께:
- 선택적 약한 돌파 알림
- 사용자 지정 사운드 파일명
StepSize의 장점 (FX, 금, 지수)
대부분의 구조 도구는 심볼을 전환하면 작동이 중단되는데, 이는 “핍”이 어디서나 같은 의미라고 가정하기 때문입니다.
QX SS는 StepSize 를 보편적 단위로 사용합니다: TickSize → PipSize → Digits 대체
모든 거리를 스텝으로 변환
steps = price_distance ÷ TickSize
예시 (일반적인 틱 크기):
- EURUSD TickSize 0.00001: 1 핍 (0.00010) = 10 스텝
- XAUUSD TickSize 0.01: $0.10 = 10 스텝, $1.00 = 100 스텝
- 지수는 브로커마다 다릅니다:
TickSize 찾는 방법
- cTrader Automate에서: Symbol.TickSize (QX SS가 안전하게 읽음)
- 플랫폼 UI에서: 심볼 사양 패널 (Market Watch 심볼 정보)
권장 최소 FVG 크기 (스텝)
이는 실용적인 시작 범위이며, 보편적 진리가 아닙니다. 변동성과 세션이 중요합니다.
M15 (기본 워크플로우)
- EURUSD: 20–40 스텝 (≈ TickSize = 0.00001)
- XAUUSD: 30–120 스텝 (≈ TickSize = 0.01)
- US500 / NAS100: 의미 있는 포인트 이동을 선택한 후 변환:
M5 (네, 변합니다)
M5는 더 많은 마이크로 갭을 생성합니다. 같은 MinFVGSteps를 유지하면 너무 많이 필터링됩니다.
일반적인 조정: MinFVGSteps를 약 30–50% 줄이기 M15 값과 비교하여 다시 조정하세요.
“횡보”는 버그가 아닙니다!
최근 스윙 고점/저점이 명확하게 HH+HL 또는 LH+LL로 정렬되지 않을 때 바이어스가 횡보가 됩니다.
횡보 구간에서 영원히 “강세” 상태를 유지하는 도구는 거짓말입니다. QX SS는 보수적으로 설계되었습니다.
프리셋 (시작점)
프리셋 A: “M15 균형” (권장 기본값)
- 스윙 강도 (M15=7): 7
- 돌파 유형: 종가
- 확인된 것만: 참
- 표시 모드: RecentSwings
- 최근 스윙 수: 30
- 최소 FVG 크기 (스텝): EURUSD 25 | XAUUSD 60 | 지수 15 (조정 후)
- 자동 숨김 완화: 참
- 최대 FVG 표시: 30
- 우측 바 확장: 50
- MTF H1 표시: 참
- MTF H4 표시: 참
프리셋 B: “M15 깨끗한 차트”
- 표시 모드: ActiveOnly
- 스윙 라벨 표시: 거짓
- 자동 숨김 완화: 참
- 최대 FVG 표시: 15–20
- (나머지는 프리셋 A 유지)
프리셋 C: “M5 스캘프 컨텍스트”
- 스윙 강도: 5–6
- 돌파 유형: 둘 다
- 확인된 것만: 참 (엄격하게 시작)
- 약한 돌파 표시: 거짓
- 최소 FVG 크기 (스텝): ~50–70% M15 값 대비
- 최근 스윙 수: 20–30
- 우측 바 확장: 30–50
cBot / 자동화 통합 (QX SS가 노출하는 내용)
QX SmartStructure는 cBot용 내부 시리즈 3개를 노출합니다:
- BiasSeries: 1은 강세, -1은 약세, 0은 그 외
- BreakSignalSeries: 1은 강세 돌파, -1은 약세 돌파, 0은 그 외
- BreakLevelSeries: 이벤트 바의 가격 레벨, 그 외는 NaN (깨끗한 센티넬)
안정성 및 성능 (v1.5.1+)
멀티 차트 설정 및 긴 세션을 위해 설계됨:
- 새로 닫힌 바에서만 처리합니다 새로 닫힌 바
- UI 업데이트는 UI Throttle (ms) 로 제한하여 CPU 사용량을 낮게 유지
- 제어된 객체 수 및 가지치기 캡으로 차트 스팸 방지
- 진정한 “하드 리로드”를 안전하게 감지 (시간 프레임/심볼/히스토리 리로드)하고 상태를 드리프트 없이 재구성
새로운 안전 옵션 (v1.5.1+)
갭 점프 시 무효화 (기본값 켬)
가격이 갭을 만들고 FVG 영역을 건드리지 않고 뛰어넘으면 (주말/뉴스 오픈), 영역은 활성 상태를 유지하는 대신 갭에 의해 무효화됨으로 표시됩니다.
이는 급격한 오프닝 후에 오래된 영역이 차트에 남는 것을 방지합니다.
재구성 시 전체 시리즈 초기화 (기본값 끔)
하드 재구성 시, 노출된 출력 시리즈의 전체 기록을 선택적으로 지워 백테스트/내보내기 일관성을 극대화합니다.
최대 성능을 위해 끔 으로 유지하세요. 전체 역사 무결성이 필요한 깊은 백테스트 워크플로우에만 켬 으로 전환하세요.
권장 기본값
- 갭 점프 시 무효화: 예 (켬)
- 재구성 시 전체 시리즈 초기화: 아니오 (끔)
면책 조항
이 도구는 시각화 및 의사결정 지원용입니다. 거래는 위험합니다. 항상 자신의 위험 관리를 사용하세요.
요약
It automatically detects and manages Fair Value Gap (FVG) zones, filtering out micro-gaps based on a configurable minimum size measured in steps, a universal unit derived from the symbol’s TickSize. The indicator applies a 50% mitigation rule to mark zones as mitigated when price reaches their midpoint, with options to auto-hide or display mitigated zones as ghosted.
QX SmartStructure includes a compact multi-timeframe (MTF) bias panel showing current timeframe bias (Bullish, Bearish, Ranging, or Unknown) and recent break events for H1 and H4 timeframes. Optional sound alerts notify users of break events, including weak breaks.
The tool supports various markets such as Forex, commodities (e.g., gold), indices, and cryptocurrencies by adapting to symbol-specific TickSize values. It exposes internal data series for integration with cBots and is optimized for performance with controlled object counts and throttled updates. The indicator does not place trades and is intended for decision support only.
고객 리뷰
5 | 100 % | |
4 | 0 % | |
3 | 0 % | |
2 | 0 % | |
1 | 0 % |


!["[Stellar Strategies] Smart ADX" 로고](https://cdn.ctrader.com/image/webp/af13b084-b6f6-41db-b7bc-c7e688b57b05_36929)

