
설명
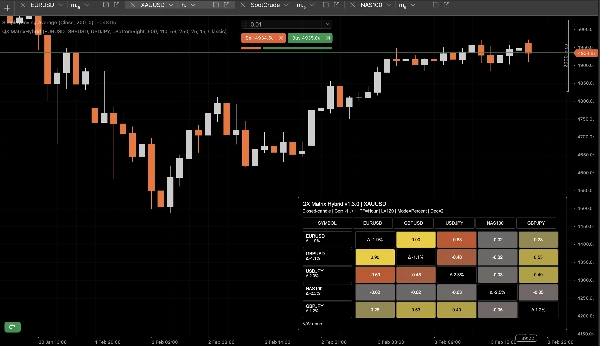
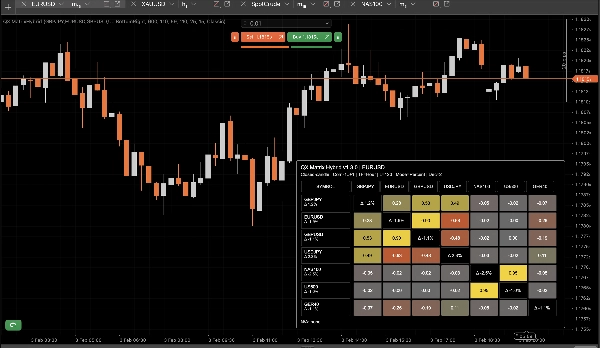
QX Matrix Hybrid 는 다중 자산 상관관계 행렬 을 깔끔한 히트맵 패널로 표시하는 시각적 지표입니다. 어떤 상품들이 함께 움직이고, 어떤 상품들이 반대로 움직이며, 시장 전반에 걸쳐 의도치 않게 노출이 중복되는 부분을 즉시 식별하는 데 도움을 줍니다.
주요 특징
- 상관관계 행렬 (-1에서 +1까지) 기호 간의 피어슨 상관관계 를 사용합니다.
- 수익 모드:
-
- 백분율 수익률
- 로그 수익률
- 기호별 강도 (Δ%) : 각 기호의 조회 기간 동안 성과를 보여줍니다 (행 레이블 및 선택적으로 대각선에 표시).
- 자동 텍스트 대비: 가독성을 위해 텍스트 색상이 배경 밝기에 맞게 조정됩니다.
- 테마 + 사용자 지정 팔레트: 여러 프리셋과 완전한 사용자 지정 색상 선택기 컨트롤을 제공합니다.
- 유연한 패널 레이아웃: 코너 도킹, 너비, 셀 크기, 여백, 행 높이 조절이 가능합니다.
- 스마트 푸터: 누락되거나 사용할 수 없는 기호를 구성 가능한 축약과 함께 나열합니다.
성능 및 업데이트 로직
여러 기호를 사용해도 반응성을 유지하도록 설계되었습니다:
- 기호별 캐싱 Symbol 및 Bars 객체를 반복적인 API 호출을 피하기 위해 저장합니다.
- 자동 캐시 무효화 Symbols CSV 또는 TimeFrame 변경 시 발생합니다.
- 종가 캔들 전용 모드로 CPU 부하를 최소화합니다 (새로운 종가 바에서 업데이트).
- 선택적 업데이트 스로틀 (ms) 라이브 모드용.
사용 방법
- +1.00: 강한 양의 동조 움직임 (높은 중복성).
- 0.00: 낮은 관계 (잠재적 분산 투자).
- -1.00: 강한 역관계 (가능한 헤지).
이 행렬을 사용하여 상관된 중복을 줄이고, 헤지 쌍을 찾으며, FX, 지수, 금속, 암호화폐 등 시장 내 “클러스터”를 이해하세요.
매개변수 (고수준)
- Symbols CSV, TimeFrame, Lookback
- 수익 모드 (백분율/로그), 소수점 자리수, 로그 자동 소수점
- 종가 캔들 전용, 업데이트 스로틀
- 강도 표시 (Δ%), 푸터 표시, 푸터 최대 누락
- 패널 레이아웃 (코너, 너비, 셀 크기, 여백)
- 색상 / 테마 (사용자 지정 팔레트 포함)
참고
- 시각화 전용입니다. 주문은 실행되지 않습니다.
- 기호는 브로커/서버에서 사용할 수 없거나 선택한 시간 프레임/조회 기간에 충분한 이력이 없으면 N/A 로 표시될 수 있습니다.
요약
AI 요약
QX MatrixHybrid is a real-time visual indicator that presents a multi-asset correlation matrix as a heatmap panel. It displays Pearson correlation coefficients ranging from -1 to +1 between up to 12 selected symbols, helping users identify strong positive correlations, inverse relationships, and low correlations for diversification or hedging purposes. The indicator supports multiple return modes, including percent and log returns, and tracks each symbol’s performance over a configurable lookback period, showing strength as percentage change.
The interface offers full customization with multiple color themes and a custom palette, adjustable panel layout options (such as docking, cell size, and margins), and automatic text contrast for readability. It includes a smart footer that lists missing or unavailable symbols with configurable truncation.
Performance optimizations include per-symbol caching to reduce API calls, automatic cache invalidation on symbol or timeframe changes, and a "Closed Candle Only" mode to minimize CPU load by updating only on new closed bars. An optional update throttle controls live update frequency.
QX MatrixHybrid is designed for use across various markets including forex, indices, commodities, metals, and cryptocurrencies. It is a visualization tool only and does not place orders. Symbols may show as unavailable if data is insufficient or missing.
지표 프로필
고객 리뷰
4.6
리뷰: 3
5 | 67 % | |
4 | 33 % | |
3 | 0 % | |
2 | 0 % | |
1 | 0 % |
고객 리뷰
February 12, 2026
The part that matters is bad ideas get easier to avoid, and 20 signals is a fair first sample.
February 9, 2026
Two sessions say more than one clean chart, and weak ideas are easier to skip.
February 5, 2026
Ngl, weak ideas are easier to skip and that is enough to keep testing it. Price action still has to agree.
상담
자주 묻는 질문(FAQ)
Signal
Indices
Commodities
GBPUSD
RSI
Bollinger
Fibonacci
Scalping
AI
XAUUSD
NAS100
MACD
BTCUSD
Forex
Breakout
EURUSD
NZDUSD
Martingale
Prop
ZigZag
Supertrend
Fair Value Gap
SMC
Crypto
Grid
Stocks
ATR
USDJPY
VWAP
트레이딩 봇, 지표, 플러그인 등 cTrader Store에서 제공되는 상품은 제3자 개발자에 의해 제공되며, 이는 단순히 정보 및 기술적 접근을 목적으로 제공된 것입니다. cTrader Store는 중개인이 아니며, 투자 조언, 개인별 추천 또는 향후 성과에 대한 어떠한 보장도 제공하지 않습니다.


가격
41.97M
거래량
208.53K
핍 수익
13
판매
353
무료 설치