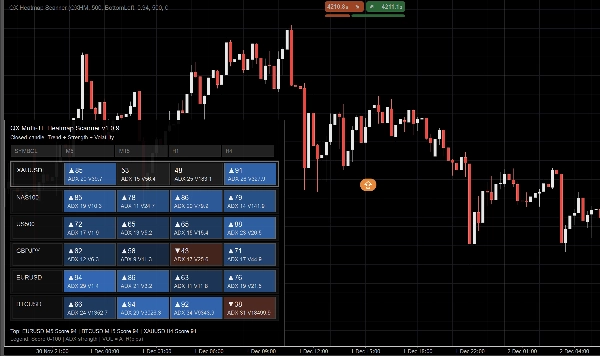
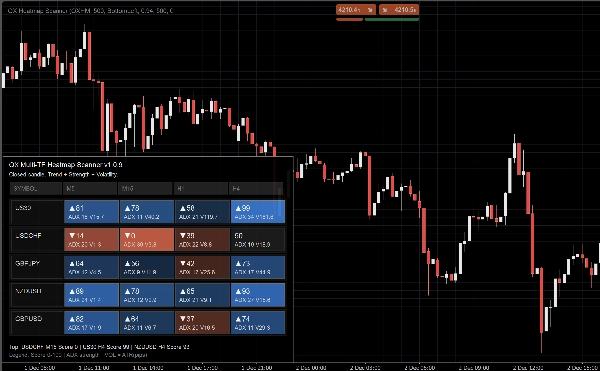
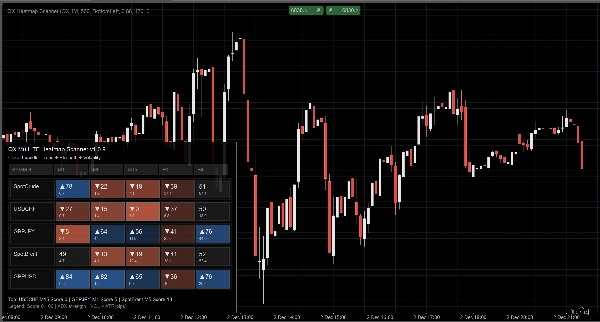
Logotipo de "QX Heatmap Scanner"
QX Heatmap Scanner
Imagen cargada de "QX Heatmap Scanner"
35.59M
Volumen operado
196.32K
Pips ganados
9
Ventas
228
Instalaciones gratis

QX Heatmap Scanner is a compact, on-chart heatmap panel that helps you scan multiple symbols and timeframes in seconds. It summarizes market Direction, Strength, and Volatility into a clear per-cell score so you can prioritize the best conditions and avoid low-quality setups.


What you see

Each cell (Symbol × Timeframe) displays:

  • Score (0–100) with directional marker (▲/▼ when biased)
  • ADX value (strength context)
  • VOL value (volatility context)


Color intensity reflects conviction. The layout stays readable even with many timeframes.

Display modes

  • Auto: adapts to available cell width
  • Full: maximum detail
  • Compact: optimized for more timeframes while keeping ADX and VOL visible
  • Minimal: ultra-tight layout for small screens


Why it helps

  • Faster top-down context before entries
  • Quick cross-market comparison without opening many charts
  • Cleaner decision-making by highlighting stronger conditions


Performance and stability

  • Designed to update on closed candles for cleaner signals and lower noise
  • Update Throttle (ms) to control CPU usage
  • Defensive handling for missing symbols or insufficient data


Main features

  • Multi-symbol, multi-timeframe heatmap panel
  • Score 0–100 per cell with clear direction cues
  • ADX and VOL displayed consistently
  • Adjustable panel corner, width, opacity, and fonts
  • Color customization (bull/bear/neutral + intensity range)


Key parameters

Symbols (CSV), Timeframes (CSV), Display Density, Panel Width/Corner/Opacity, Show VOL, Font Sizes, Update Throttle.


Note: This tool provides market context. It is not an auto-trading system and does not replace risk management.

Indicator profile
0.0
Valoraciones: 0
Valoraciones de clientes
Este producto todavía no se ha valorado. ¿Ya lo ha probado? Sea el primero en informar a otros.
BTCUSD
Forex
Signal
Breakout
RSI
Indices
EURUSD
Commodities
GBPUSD
NZDUSD
Fibonacci
VWAP
Bollinger
Scalping
ATR
Crypto
Stocks
XAUUSD
NAS100
Fair Value Gap (FVG)
USDJPY
Products available through cTrader Store, including trading bots, indicators and plugins, are provided by third-party developers and made available for informational and technical access purposes only. cTrader Store is not a broker and does not provide investment advice, personal recommendations or any guarantee of future performance.

Más de este autor

Free educational Renko cBot made to help traders learn how Renko automation works and to showcase my development style.
QX SessionBox ORB: Session boxes + ORB levels + clean dashboard with optional closed-candle breakout signals.
SMC without the mess: Clean structure + auto-managing FVGs + MTF panel. Hard-right-edge, step size-based for any symbol.
Multi-timeframe market-state dashboard: Score (-100..+100) + UP/NEUT/DN per TF, with optional closed-candle arrows.
Session Volume Profile + Composite. POC/VAH/VAL, Focus/Solo. Fast, clean, no ghosts, live-ready.
Learn candlestick patterns with live signals, objective rules, context notes, and an interactive quiz training mode.
Real-time multi-asset correlation matrix with 5 themes, Δ% performance tracking, and full customization. Up to 12 symbol
Candle pressure overlay for cTrader. Instantly read close strength, directional bias, and momentum quality.
Risk-first position sizing panel for indices and FX majors. Clean. Non-repainting. Built for real trading.
Pivot Points (Classic/Fibo/Camarilla/Woodie) with price zones, multi-timeframe confluence (D/W/M) and smart alerts.
Liquidity sweeps without clutter. Equal highs/lows pools, sweeps + reclaim, filters + compact panel. StepSize-based.

Puede interesarle

Super EMA the best EMA indicator
Delta Volume Indicator - Advanced Order Flow Analysis for cTrader
Anchor-based Fibonacci channel that grows with the market. Seven display modes, auto-direction, fully draggable.
Liquidity Cluster Order automatically detects and draws accumulation zones & distribution zones
Robust Cumulative delta,Atr and imbalance indicator.
E7 BBKG indicator with 80% plus accuracy used to show both, possible reversal and trend.
Patter Scanner all Chart Let your chart tell you when patterns appear
Auto-detect supply & demand zones, remove broken levels, and trade smarter with real-time alerts. Precision made simple.
DXY HMA Indicator
Session Volume Profile
Volume Delta Oscillator Free Indicator
Fixed Range Volume Profile - TradingView Style (POC, VAH, VAL)
Bússola para Decisões de Trading Precisas e Eficientes!
Spot breakouts & filter fakeouts with dynamic volatility bands + ALMA trend validation. 100% Free.
Stochastic Confluence Pro (RSI + Divergence)
you could put your check list in your chart you could split your test with “,” you could put your checklist in indicat
KAMA Keltner – Adaptive Volatility Channel for Precision Trading
Plot ATR-based SL and 1R/2R/3R TPs instantly for any trade, with clear R-multiple risk mapping.
35.59M
Volumen operado
196.32K
Pips ganados
9
Ventas
228
Instalaciones gratis