
Volume Meter
지표
2 구매
버전 1.0, Sep 2025
Windows, Mac
5.0
리뷰: 1
설명
📘 이 지표가 하는 일
- 히스토그램으로 틱 거래량(바당 가격 변동 횟수)을 표시합니다.
- 외환 시장에서는 중개인이 실제 거래량을 거의 제공하지 않으므로 틱 거래량이 대용으로 사용됩니다.
- 주식/CFD/선물에서는 실제 거래량을 얻을 수 있습니다.
- 기본값 20기간의 거래량 이동평균을 오버레이합니다.
- 이는 현재 바의 거래량이 비정상적으로 높거나 낮은지 빠르게 파악할 수 있는 “기준선” 역할을 합니다.
🎯 확인용으로 사용하는 방법
이 지표는 독립적인 신호 생성기가 아닙니다. 대신, 트레이더들은 다른 전략의 설정을 확인하는 데 사용합니다:
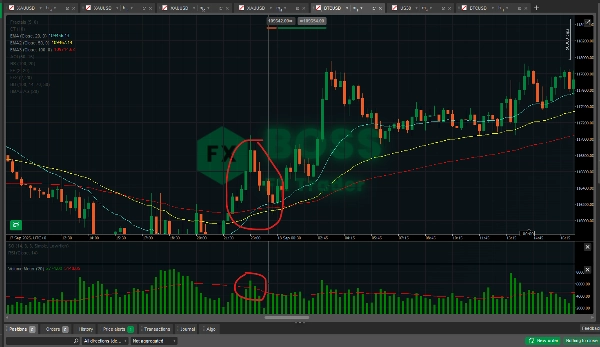
- 돌파 확인
-
- 가격이 저항선을 상향 돌파하거나 지지선을 하향 돌파할 때, 돌파 캔들이 이동평균보다 높은 거래량을 가지고 있는지 확인하세요.
- 높은 거래량은 더 많은 참여자가 움직임에 동참했음을 확인 → 돌파가 더 신뢰할 만함.
- 낮은 거래량 돌파 = 거짓 돌파 가능성 증가.
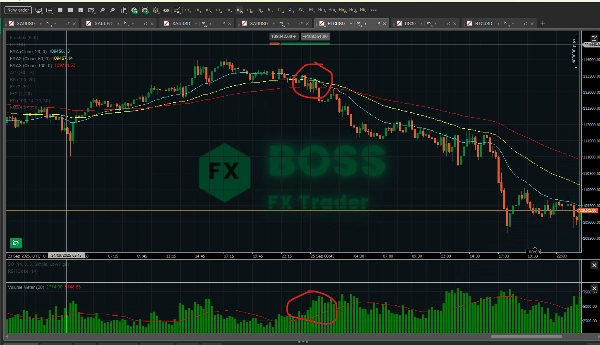
- 추세 지속 대 소진
-
- 강한 추세에서는 되돌림 캔들이 충격 캔들에 비해 낮은 거래량을 가지는 경우가 많습니다.
- 되돌림이 낮은 거래량으로 발생하고 다음 움직임이 더 높은 거래량으로 재개되면 → 추세 지속을 확인합니다.
- 추세가 계속되지만 거래량이 매번 줄어든다면 → 소진 가능성, 반전을 대비하세요.
- 반전 확인
-
- 큰 반전 캔들(핀 바, 엔골핑 캔들, 프랙탈)은 거래량 급증이 뒷받침될 때 더 강력합니다.
- 예: 지지선에서 높은 거래량을 동반한 강세 핀 바 = 낮은 거래량의 동일 핀 바보다 더 강한 반전 신호.
- 거짓 신호 필터
-
- 주요 시스템이 매수/매도 신호를 주지만 거래량이 약하면(평균 이하) 해당 거래를 건너뛸 수 있습니다.
- 과도한 거래를 줄이고 노이즈를 필터링하는 데 도움이 됩니다.
📊 효과성
- 외환 시장에서: 틱 거래량은 실제 거래량과 강한 상관관계가 있음이 여러 연구에서 밝혀졌습니다(70~90% 상관관계). 따라서 유용하지만 완벽하지는 않습니다.
- 주식/선물/CFD에서는: 실제 거래량을 측정하므로 훨씬 더 강력합니다.
- 확인용으로: 가격 움직임 및 다른 지표(예: EMA, RSI, 프랙탈)과 함께 사용하는 것이 가장 좋습니다. 거래량만 의존하는 것은 위험합니다.
- 강점: 돌파를 확인하고, 거짓 움직임을 필터링하며, 소진을 포착합니다.
- 약점: 방향을 예측하지 않으며, 설정이 있을 때 신뢰도를 더할 뿐입니다.
✅ 실용적인 팁:
이 지표를 트리거가 아닌 필터로 사용하세요. 예를 들어:
- EMA 교차(매수 신호)를 확인합니다.
- 거래량이 이동평균 이상인지 확인하세요. 그렇다면 거래를 실행하고, 아니면 기다리세요.
이렇게 하면 모멘텀이 시장 참여에 의해 뒷받침될 때만 거래하게 됩니다.
요약
AI 요약
Volume Meter is a trading indicator that displays tick volume—the number of price changes per bar—as a histogram. In Forex markets, where real traded volume data is often unavailable, tick volume serves as a proxy, while in stocks, CFDs, and futures, real volume data may be used. The indicator overlays a moving average of volume (default 20-period) to provide a baseline, helping traders identify whether current volume is unusually high or low.
This tool is designed to confirm trading setups rather than generate standalone signals. It assists in validating breakouts by checking if breakout candles have volume above their moving average, indicating stronger market participation. It also helps distinguish trend continuation from exhaustion by comparing volume levels during pullbacks and impulse moves. Additionally, it supports reversal confirmation by highlighting volume spikes on significant reversal candles and filters false signals by advising caution when volume is weak despite buy or sell signals from other systems.
Volume Meter is applicable across various markets including Forex, stocks, indices, commodities, and cryptocurrencies. Its effectiveness is enhanced when combined with price action and other indicators such as EMA or RSI. The indicator aids in improving trade decision confidence by integrating volume analysis as a confirmation and filtering tool.
지표 프로필
고객 리뷰
5.0
리뷰: 1
5 | 100 % | |
4 | 0 % | |
3 | 0 % | |
2 | 0 % | |
1 | 0 % |
고객 리뷰
October 1, 2025
the first 10 trades should stay boring, and the checklist becomes easier to follow.
상담
자주 묻는 질문(FAQ)
BTCUSD
Forex
Breakout
Indices
EURUSD
Commodities
GBPUSD
NZDUSD
Prop
Supertrend
Crypto
Stocks
XAUUSD
NAS100
USDJPY
트레이딩 봇, 지표, 플러그인 등 cTrader Store에서 제공되는 상품은 제3자 개발자에 의해 제공되며, 이는 단순히 정보 및 기술적 접근을 목적으로 제공된 것입니다. cTrader Store는 중개인이 아니며, 투자 조언, 개인별 추천 또는 향후 성과에 대한 어떠한 보장도 제공하지 않습니다.
이 작성자의 상품 더 보기


!["[CB] Pivot Points Pro" 로고](https://cdn.ctrader.com/image/webp/43463c82-67b0-4f10-a4ba-901bba091d81_32594)


가격
가입일 29/05/2025
3.04M
거래량
45.22K
핍 수익
29
판매
768
무료 설치