

설명
이 공정 가치 격차(FVG) 지표는 거래자가 가격 불균형을 식별하는 데 도움이 되는 기술적 분석 도구입니다.
특징:
- 강세 및/또는 약세 격차의 가시성 전환
- 쉬운 시각화를 위한 색상 코드 상자 표시 (기본값: 강세는 녹색, 약세는 빨간색, 중간 수준은 금색)
- 차트 혼잡을 줄이기 위한 조정 가능한 조회 기간
- 더 나은 시각화를 위한 구성 가능한 상자 확장 설정(오프셋)
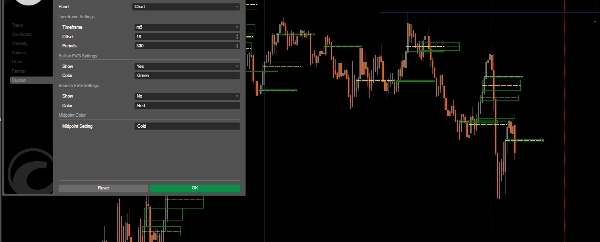
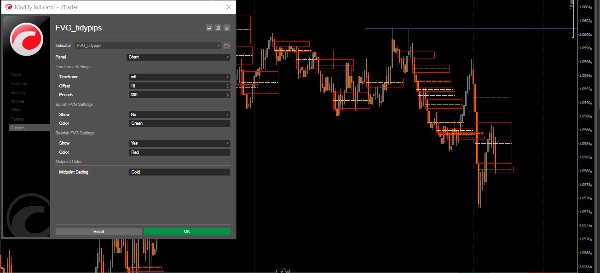
매개변수:
- 시간 프레임: FVG를 표시할 선호하는 시간 프레임 선택
- 오프셋: FVG 상자의 수평 확장 조정 (3-500)
- 기간: 과거 FVG 계산을 위한 조회 기간 설정
- 강세/약세 FVG 표시
- 색상: 강세 FVG, 약세 FVG 및 중간선의 색상 사용자 정의
거래 응용:
- 지지 및 저항: FVG는 종종 강력한 지지/저항 수준으로 작용
- 가격 자석: 채워지지 않은 격차는 가격 움직임을 끌어당기는 경향이 있음 (DOL)
- 시장 구조: 잠재적 반전 구역 및 관심 지속 지점 식별에 도움
- 오더 블록 분석: 기관 거래 구역 식별
최고의 적용 관행:
- 다른 기술적 분석 도구와 함께 사용하세요.
- 높은 시간 프레임은 더 중요한 FVG를 생성하며, 낮은 시간 프레임 FVG는 높은 시간 프레임 방향성 편향과 함께 사용
- 가격이 FVG 구역으로 돌아올 때 반응을 모니터링하세요
- 중간선에 주목하세요. 이는 종종 가격 자석 역할을 합니다
제가 게시한 다른 유용한 지표들도 확인해 보세요. 이 지표나 다른 지표들이 도움이 되셨다면, 구매하거나 기부하여 제 작업을 지원해 주세요. 여러분의 지원은 제가 이 도구들을 계속 개발하고 개선할 수 있도록 도와줄 뿐만 아니라, 여러분의 거래 경험을 향상시키기 위해 새로운 가치 있는 지표를 계속 만들 수 있도록 보장합니다. 지속적인 지원에 감사드립니다!
https://buymeacoffee.com/tidypips
요약
AI 요약
The FVG_tidypips indicator is a technical analysis tool designed to identify Fair Value Gaps (FVGs), which represent price imbalances on trading charts. It visually highlights bullish and bearish gaps using color-coded boxes—green for bullish, red for bearish, and gold for midpoint levels—facilitating quick recognition of potential support and resistance zones. Users can toggle the visibility of bullish and/or bearish gaps, adjust the lookback period to manage chart clutter, and configure the horizontal extension (offset) of the FVG boxes for clearer visualization.
Key parameters include selecting the timeframe for FVG display, setting the offset range (3–500), defining the lookback period for historical gap calculation, and customizing colors for different gap types and midpoint lines. The indicator supports trading applications such as identifying strong support/resistance levels, spotting price magnets where unfilled gaps attract price action, analyzing market structure for potential reversal or continuation zones, and detecting institutional order block areas.
Best practices recommend using this indicator alongside other technical tools, focusing on higher timeframes for more significant FVGs, and monitoring price reactions when revisiting FVG zones. The midpoint line is noted as an important price magnet. This tool is applicable across various markets, including commodities like gold (XAUUSD).
지표 프로필
고객 리뷰
4.3
리뷰: 3
5 | 33 % | |
4 | 67 % | |
3 | 0 % | |
2 | 0 % | |
1 | 0 % |
고객 리뷰
November 22, 2024
Good idea with limits for traders who use ICT or SMC concepts. It gives value around smart money style analysis, but zones still need manual validation. A good sample is 20 FVG or order block reactions, with messy 0.705 areas skipped. The zone is more convincing when structure and risk both make sense.
November 21, 2024
November 21, 2024
Small but practical edge for smart money style analysis. it adds structure around liquidity, gaps and market shifts, especially when used for mapping zones before entries. For SMC logic, I trust zones more when 0.5 mitigation, BOS and liquidity sweep line up. The zone is more convincing when structure and risk both make sense.
상담
자주 묻는 질문(FAQ)
Commodities
XAUUSD
트레이딩 봇, 지표, 플러그인 등 cTrader Store에서 제공되는 상품은 제3자 개발자에 의해 제공되며, 이는 단순히 정보 및 기술적 접근을 목적으로 제공된 것입니다. cTrader Store는 중개인이 아니며, 투자 조언, 개인별 추천 또는 향후 성과에 대한 어떠한 보장도 제공하지 않습니다.
이 작성자의 상품 더 보기


좋아하실 만한 다른 항목


!["[Hamster-Coder] Moving Average MTF" 로고](https://cdn.ctrader.com/image/webp/b11b98b1-194d-4b8e-b00e-d611826ad159_31226)


가격
15
판매
4.63K
무료 설치