
설명
차트에서 활성화하려면 Alt + 드래그를 하세요.
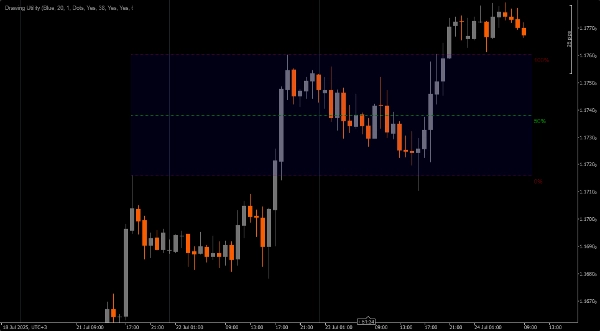
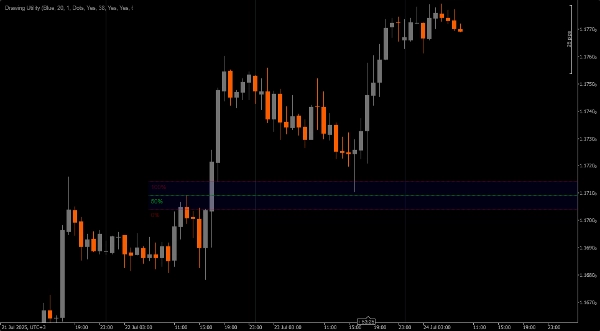
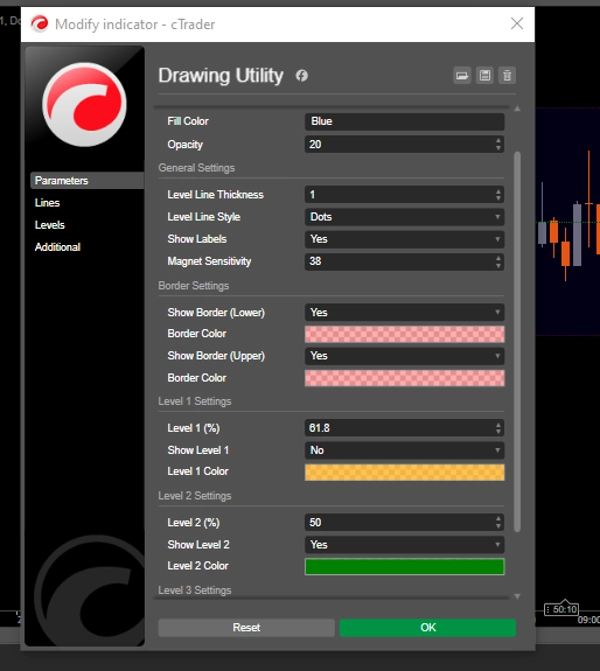
사용자 정의 가능한 그리기 도구.
1. 빠른 접근 피보나치.
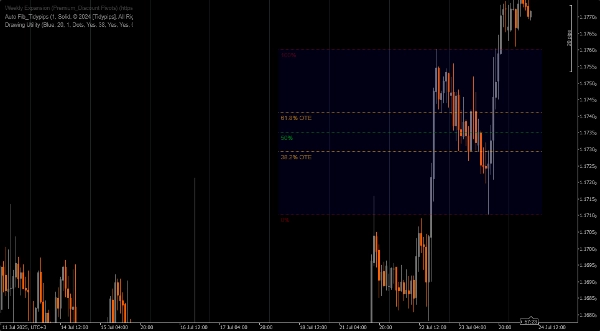
2. 공정 가치 갭 표시기
3. 측정 도구
4. 관심 지점 표시기
5. 또는 차트에 주석을 달기에 적합하다고 생각되는 기타 용도(생각하지 못한 것 포함)
참고 **차트에서 활성화하려면 Alt + 드래그를 하세요.**
요약
AI 요약
Drawing Utility is a customizable chart annotation tool designed for trading platforms. It features a rectangular box with five adjustable Fibonacci levels, which can also be customized to user-defined values. The utility is activated by pressing Alt and dragging on the chart. Key functionalities include quick access to Fibonacci retracement levels, marking Fair Value Gaps, measuring price movements, and highlighting Points of Interest. Additionally, it supports flexible use cases for various chart annotations, allowing traders to tailor it to their specific analysis needs.
지표 프로필
고객 리뷰
0.0
리뷰: 0
고객 리뷰
이 상품에 대한 리뷰가 아직 없습니다. 이미 사용해 보셨나요? 다른 사람들에게 가장 먼저 소개해 주세요!
상담
자주 묻는 질문(FAQ)
트레이딩 봇, 지표, 플러그인 등 cTrader Store에서 제공되는 상품은 제3자 개발자에 의해 제공되며, 이는 단순히 정보 및 기술적 접근을 목적으로 제공된 것입니다. cTrader Store는 중개인이 아니며, 투자 조언, 개인별 추천 또는 향후 성과에 대한 어떠한 보장도 제공하지 않습니다.
이 작성자의 상품 더 보기


!["[Stellar Strategies] Wave Trend Pro" 로고](https://cdn.ctrader.com/image/webp/5f226fbb-245a-41cd-9cdd-b018257d5e6d_28617)
가격
15
판매
4.61K
무료 설치