


설명
MACD 기반 가격 예측
개요
이 지표는 전통적인 MACD의 한계를 넘어 과거 분석을 넘어서며 혁신적으로 과거 기억과 통계 알고리즘 을 도입하여 미래 가격 움직임을 예측합니다.
핵심 메커니즘:
- 과거 추세 기억: 이 지표는 과거 MACD 추세(상승 및 하락)의 가격 변위를 시작점과 비교하여 기록하며, 최대 50개의 최근 추세에 대한 통계 데이터베이스를 구축합니다.
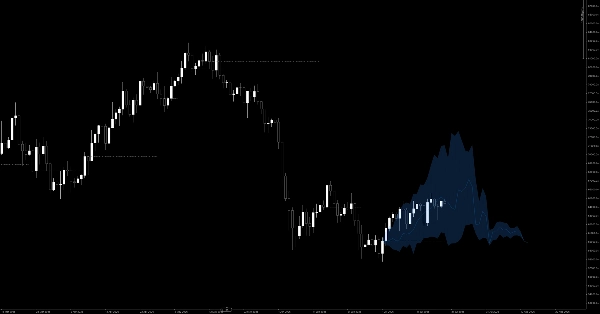
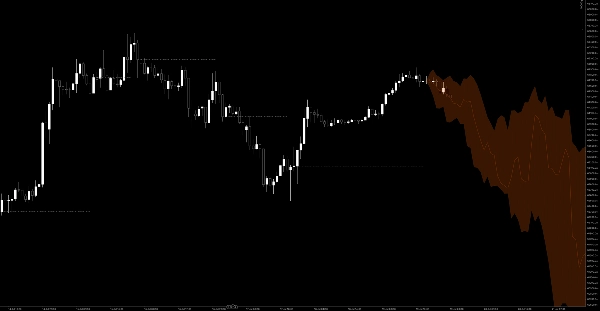
- 확률 예측 팬: 새로운 MACD 교차가 발생할 때(제로 라인 또는 신호선을 교차할 때), 지표는 과거 기억에서 데이터를 불러옵니다. 가격 변동의 20%, 50%, 80% 백분위수를 계산하고 차트 오른쪽에 다음 100봉에 대한 확률 예측 팬 을 투영합니다.
- 동적 신호 영역 클라우드: 추세 반전이 시작된 "기준 가격"을 표시합니다. 실시간 가격이 이 기준 가격 위에 있고 상승 추세일 때는 녹색 클라우드 영역을, 반대로 하락 추세일 때는 빨간 클라우드를 그려 실제 상승 또는 하락 모멘텀을 즉시 시각적으로 확인할 수 있습니다.
(참고: 이 지표는 고도로 최적화된 그래픽 렌더링을 특징으로 하며, 명확한 시각 영역을 위한 매끄러운 다각형 블렌딩과 매우 깔끔한 차트 경험을 위한 정교한 불연속 기준선을 사용합니다.)
거래 규칙 및 사용자 가이드
이 지표는 단순한 "교차 시 매수/매도" 신호를 넘어서 확률적 로드맵 을 제공합니다.
1. 진입점 찾기 (추세 확인)
- 롱 진입: 상승 MACD 교차가 발생하면, 차트 오른쪽에 위로 향하는 파란 예측 팬 이 나타납니다. 무턱대고 진입하지 말고, 가격이 점선-점선 기준선(기준 가격) 위에 안정되는지, 그리고 녹색 상승 클라우드 가 확장되기 시작하는지 확인하세요. 이는 현재 모멘텀이 과거 상승 통계와 일치함을 확인하여 조정 구간 매수에 좋은 기회를 제공합니다.
- 숏 진입: 하락 MACD 교차가 발생하면, 차트에 아래로 향하는 주황색 예측 팬 이 나타납니다. 가격이 기준선 아래에 머무르고 빨간 하락 클라우드 가 확장되는 것을 확인하여 조정 구간 숏 진입을 확정하세요.
2. 이익 실현 목표 설정
예측 팬은 훌륭한 동적 이익 실현 가이드 역할을 합니다:
- 목표 1 (팬 내부 중간선): 팬 내부의 중간선은 50% 과거 백분위수(평균 궤적)를 나타냅니다. 가격이 이 선에 닿으면 현재 움직임이 과거 평균을 달성한 것이므로 부분 이익 실현에 이상적인 지점입니다.
- 목표 2 (팬의 외곽선): 상단 경계(80% 백분위수) 또는 하단 경계(20% 백분위수)는 과거 극단을 나타냅니다. 가격이 이 경계에 도달하면 모멘텀이 크게 소진되어 반전 또는 깊은 조정이 매우 가능성이 높으므로 전체 포지션 청산을 고려하세요.
3. 과학적인 손절 위치 설정
- 회색 점선(기준 가격)은 모든 추세의 기준선 역할을 합니다.
- 롱 포지션 진입 시, 이 회색선 바로 아래에 손절매를 설정하세요. 가격이 기준 가격을 하향 돌파하고 녹색 클라우드가 사라지면 실제 가격 움직임이 과거 상승 확률을 무효화한 것이므로 추세 설정이 실패한 것이며 즉시 손실을 제한해야 합니다.
4. 횡보장 필터
- MACD 교차가 발생했지만 예상된 예측 팬이 매우 평평하거나 수축된 경우, 과거 유사한 교차는 횡보 또는 횡적인 움직임만을 초래했음을 의미합니다.
- 평평한 팬이 보이면 거래를 피하고 기다리세요. 팬이 명확한 상향 또는 하향 확장을 보이는 다음 사이클을 기다리십시오.
요약
AI summary
MACD Based Price Forecasting is a technical indicator that extends traditional MACD analysis by incorporating historical memory and statistical algorithms to predict future price movements. It records price displacements from up to 50 recent MACD trends, both bullish and bearish, creating a statistical database for forecasting.
Key features include a probability forecasting fan that projects 20%, 50%, and 80% price change percentiles for the next 100 bars following a MACD crossover. The indicator visually displays this fan on the chart, with blue fans for bullish signals and orange for bearish. A dynamic signal area cloud highlights momentum: green for confirmed uptrends above a reference price and red for downtrends below it.
Trading guidance involves waiting for price confirmation above or below the reference price and cloud before entering long or short positions. The forecasting fan also serves as a dynamic take-profit guide, with the middle line representing average historical moves and outer edges indicating potential trend exhaustion. Stop-loss placement is recommended just beyond the reference price line to manage risk.
Additionally, the indicator filters ranging markets by identifying flat or contracted fans, signaling sideways price action and advising traders to avoid entering trades during such periods. The indicator supports visualization outputs and is tagged under MACD and momentum indicators.
Key features include a probability forecasting fan that projects 20%, 50%, and 80% price change percentiles for the next 100 bars following a MACD crossover. The indicator visually displays this fan on the chart, with blue fans for bullish signals and orange for bearish. A dynamic signal area cloud highlights momentum: green for confirmed uptrends above a reference price and red for downtrends below it.
Trading guidance involves waiting for price confirmation above or below the reference price and cloud before entering long or short positions. The forecasting fan also serves as a dynamic take-profit guide, with the middle line representing average historical moves and outer edges indicating potential trend exhaustion. Stop-loss placement is recommended just beyond the reference price line to manage risk.
Additionally, the indicator filters ranging markets by identifying flat or contracted fans, signaling sideways price action and advising traders to avoid entering trades during such periods. The indicator supports visualization outputs and is tagged under MACD and momentum indicators.
지표 프로필
지표 카테고리
추세
출력 유형
시각화
데이터 요구 사항
막대만
거래량
틱 데이터
지원되는 신호
크로스
다이버전스
돌파
반전
추세 강도
변동성
고객 리뷰
0.0
리뷰: 0
고객 리뷰
이 상품에 대한 리뷰가 아직 없습니다. 이미 사용해 보셨나요? 다른 사람들에게 가장 먼저 소개해 주세요!
상담
자주 묻는 질문(FAQ)
MACD
트레이딩 봇, 지표, 플러그인 등 cTrader Store에서 제공되는 상품은 제3자 개발자에 의해 제공되며, 이는 단순히 정보 및 기술적 접근을 목적으로 제공된 것입니다. cTrader Store는 중개인이 아니며, 투자 조언, 개인별 추천 또는 향후 성과에 대한 어떠한 보장도 제공하지 않습니다.
이 작성자의 상품 더 보기















!["Wyckoff Toolkit [Iridio Capital]" 로고](https://cdn.ctrader.com/image/webp/5318c788-91ef-4297-bca6-4ce73b1516a8_61556)






가격
534.4M
거래량
9.76M
핍 수익
4
판매