
설명
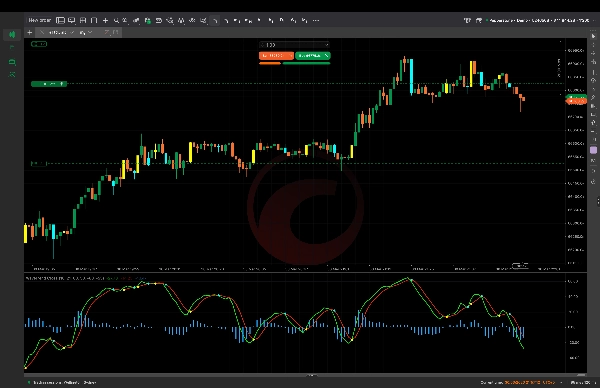
WaveTrend Cross는 복잡함 없이 명확함을 원하는 트레이더를 위해 설계된 강력하고 깔끔하며 정밀한 모멘텀 지표입니다. 검증된 WaveTrend 논리를 기반으로 하여 부드러운 시장 주기, 교차 신호 및 모멘텀 변화를 사용해 높은 확률의 매수 및 매도 기회를 한눈에 식별할 수 있도록 도와줍니다.
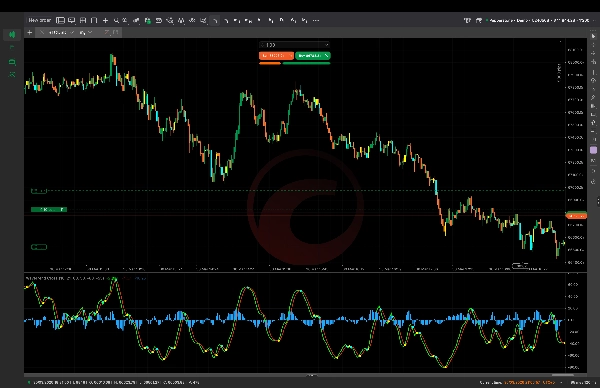
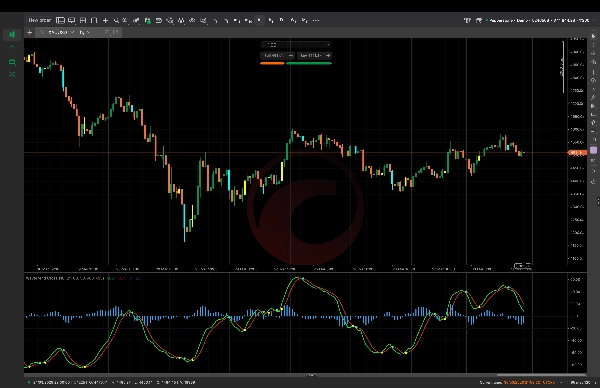
과부하된 지표와 달리 WaveTrend Cross는 실제 거래 조건에서 효과적인 것에 집중합니다. WT1과 WT2 라인은 시장 모멘텀을 추적하고 명확한 교차 신호를 생성하며, 히스토그램은 강도와 방향을 시각적으로 확인시켜 줍니다. 이 조합은 트레이더가 조기 반전을 포착하고 자신 있게 추세를 탈 수 있게 합니다.
비트코인과 같은 빠르게 움직이는 시장에 최적화되어 있으며 M1 및 M5와 같은 낮은 타임프레임에서 뛰어난 성능을 발휘하여 스캘퍼와 당일 거래자에게 이상적입니다. 암호화폐, 외환 또는 지수를 거래하든 이 지표는 부드럽게 적응하며 불필요한 잡음 없이 일관된 신호를 제공합니다.
주요 특징:
- 쉽게 의사결정할 수 있는 명확한 매수/매도 교차 신호
- 추세 강도 확인을 위한 모멘텀 히스토그램
- 고위험 진입을 걸러내는 과매수 및 과매도 구역
- 가볍고 빠름 — 지연이나 혼란 없음
- BTC 스캘핑 및 당일 거래에 완벽함
WaveTrend Cross는 단순한 지표가 아니라 적절한 위험 관리와 추세 인식과 결합될 때 완벽한 거래 우위입니다. 간단하고 효과적이며 실제 수익을 위해 만들어졌습니다. 🚀📊
요약
AI 요약
WaveTrend Cross is a momentum-based trading indicator designed to provide clear buy and sell signals through the analysis of market cycles and momentum shifts. It features two lines, WT1 and WT2, that track momentum and generate crossover signals, complemented by a histogram that confirms trend strength and direction. The indicator highlights overbought and oversold zones to help filter high-risk entries. Optimized for fast-moving markets such as Bitcoin, it performs well on lower timeframes like M1 and M5, making it suitable for scalping and intraday trading. WaveTrend Cross supports multiple markets including crypto, forex, indices, commodities, and stocks. Its lightweight design aims to deliver precise signals without lag or clutter, facilitating early reversal detection and confident trend following. The indicator outputs cross signals, visual momentum confirmation, and filtering features to assist traders in decision-making.
지표 프로필
지표 카테고리
추세
출력 유형
신호
시각화
필터
데이터 요구 사항
막대만
지원되는 신호
크로스
고객 리뷰
4.0
리뷰: 2
5 | 0 % | |
4 | 100 % | |
3 | 0 % | |
2 | 0 % | |
1 | 0 % |
상담
자주 묻는 질문(FAQ)
BTCUSD
Forex
Signal
Breakout
Indices
EURUSD
Commodities
GBPUSD
NZDUSD
RSI
Prop
Scalping
SMC
Crypto
Stocks
XAUUSD
NAS100
MACD
USDJPY
트레이딩 봇, 지표, 플러그인 등 cTrader Store에서 제공되는 상품은 제3자 개발자에 의해 제공되며, 이는 단순히 정보 및 기술적 접근을 목적으로 제공된 것입니다. cTrader Store는 중개인이 아니며, 투자 조언, 개인별 추천 또는 향후 성과에 대한 어떠한 보장도 제공하지 않습니다.
이 작성자의 상품 더 보기


!["Smart Money Concepts (SMC) [Iridio Capital]" 로고](https://cdn.ctrader.com/image/webp/28b69fd1-ef54-4bed-9487-07e78e883be4_40934)


가격
가입일 04/03/2026
3
판매