present
ลงทะเบียนและรับส่วนลด $50 สำหรับการซื้อครั้งแรกของคุณ
Trading product for Bubble Indicator 2.0 อินดิเคเตอร์ Breakout Scalping, image 2
ตั้งแต่ 10/01/2026
7
การขาย

คำอธิบาย

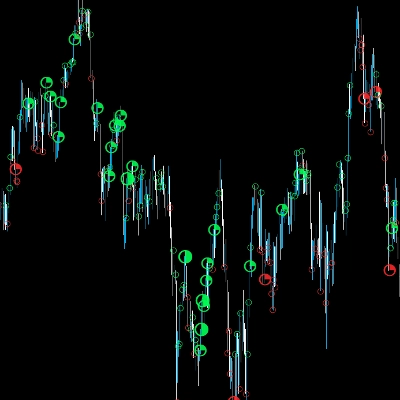
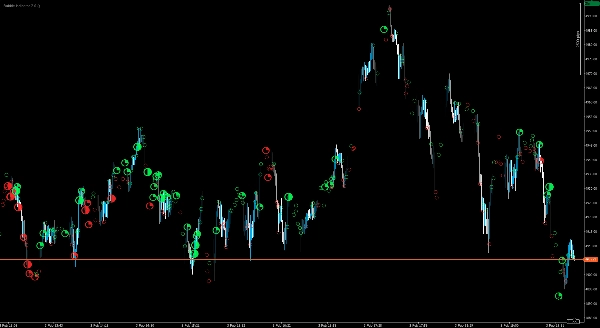
Delta Peak Bubbles ถูกสร้างขึ้นสำหรับเทรดเดอร์ที่ต้องการวิธีที่รวดเร็วและมองเห็นได้ชัดเจนในการระบุ “จุดที่ตลาดกำลังทำงาน” บนกราฟแท่งเทียนแท่งเล็ก ๆ แทนที่จะทำให้หน้าจอของคุณรกด้วยแผงเพิ่มเติม มันจะวาดฟองอากาศที่ชัดเจนและมีระดับโดยตรงบนกราฟเพื่อแสดงการระเบิดของกิจกรรมที่มีความเข้มข้นสูงแบบเรียลไทม์

ตัวบ่งชี้นี้เน้นไปที่ช่วงเวลาสูงสุดภายในแต่ละแท่งและแสดงภาพด้วยมาตราส่วนความแข็งแรงที่อ่านง่าย (ตั้งแต่วงกลมที่ละเอียดอ่อนจนถึงดาวที่โดดเด่นสำหรับเหตุการณ์ที่แข็งแกร่งที่สุด) ฟองอากาศจะถูกระบุสีเพื่อให้เข้าใจทิศทางได้อย่างรวดเร็ว ทำให้ง่ายต่อการแยกความแตกต่างระหว่างแรงกดดันขาขึ้นกับขาลงในทันที

ออกแบบมาเพื่อการทำงานเทรดที่ใช้งานได้จริง Delta Peak Bubbles ทำงานได้ดีเป็นพิเศษสำหรับ:

  • การเก็งกำไรระยะสั้นและการเทรดโมเมนตัมระยะสั้น
  • การยืนยันการเบรกเอาต์และการติดตามแรงกระตุ้น
  • การระบุโซนปฏิกิริยาและจุดที่อาจเกิดความเหนื่อยล้า
  • การเพิ่ม “ชั้นความร้อน” ให้กับกลยุทธ์ Price Action / SMC / ระดับสำคัญ

คู่มือความแข็งแรงของฟองอากาศ

ฟองอากาศถูกจัดระดับเป็นสี่ระดับความแข็งแรงเพื่อช่วยให้คุณแยกกิจกรรมปกติออกจากการระเบิดที่มีผลกระทบสูงได้อย่างรวดเร็ว:

  • ระดับ 1 – ต่ำ: ○ (การระเบิดเล็กน้อย)
  • ระดับ 2 – กลาง: ◔ (การระเบิดปานกลาง)
  • ระดับ 3 – สูง: ◑ (การระเบิดที่แข็งแกร่ง)
  • ระดับ 4 – รุนแรง: ★ (การระเบิดที่แข็งแกร่งมาก / โดดเด่น)

สีแสดงถึงแรงกดดันทิศทาง (สีเขียว = ขาขึ้น, สีแดง = ขาลง)

การควบคุมการแสดงผลทำให้หน้าจอสะอาดในทุกการจัดวาง รวมถึงจอ 4K ดังนั้นคุณจึงสามารถรักษาความอ่านง่ายของกราฟในขณะที่ยังเห็นช่วงเวลาสำคัญได้

ข้อจำกัดความรับผิดชอบ: การเทรด/การลงทุนมีความเสี่ยงสูงและอาจส่งผลให้สูญเสียเงินลงทุนทั้งหมด ตัวบ่งชี้นี้จัดทำขึ้นเพื่อวัตถุประสงค์ในการให้ข้อมูลและวิเคราะห์เท่านั้น และไม่ได้เป็นคำแนะนำทางการเงิน ข้อเสนอ หรือคำแนะนำ การใช้งานเป็นความเสี่ยงของคุณเอง; คุณยังคงรับผิดชอบแต่เพียงผู้เดียวสำหรับการตัดสินใจและผลลัพธ์ในการเทรดทั้งหมด ผู้ให้บริการไม่รับประกันหรือรับรองใด ๆ (โดยชัดแจ้งหรือโดยนัย) เกี่ยวกับความถูกต้อง ความสมบูรณ์ ความทันเวลา ประสิทธิภาพ ความเหมาะสมสำหรับการค้า หรือความเหมาะสมสำหรับวัตถุประสงค์เฉพาะ ในขอบเขตที่กฎหมายอนุญาต ผู้ให้บริการจะไม่รับผิดชอบต่อความสูญเสียโดยตรงหรือโดยอ้อม ความเสียหาย หรือกำไรที่สูญหายที่เกิดขึ้นจากหรือเกี่ยวข้องกับการใช้ตัวบ่งชี้นี้ (รวมถึงแต่ไม่จำกัดเพียงความสูญเสียเนื่องจากสภาพตลาด ปัญหาข้อมูล/แพลตฟอร์ม ข้อผิดพลาดในการตั้งค่า หรือการใช้งานผิด) ผลการดำเนินงานในอดีตไม่ใช่ตัวบ่งชี้ที่เชื่อถือได้ของผลลัพธ์ในอนาคต

สรุป

สรุปโดย AI
Bubble Indicator 2.0 is a tick-chart overlay indicator designed for the cTrader platform that visually highlights strong momentum spikes in real time. It displays graded bubbles directly on tick charts to indicate peak moments of market activity, using a four-level strength scale from minor (Level 1) to extreme spikes (Level 4). The bubbles are color-coded—green for bullish pressure and red for bearish—to provide immediate directional context. This indicator is suited for scalping, short-term momentum trading, breakout confirmation, impulse tracking, identifying reaction zones, and enhancing price action or smart money concept strategies. Display controls ensure clarity on various screen layouts, including 4K monitors, by keeping the chart readable while emphasizing significant market moves.
โปรไฟล์อินดิเคเตอร์

การสนทนา

รีวิวจากลูกค้า

4.3
รีวิว: 3
5
33 %
4
67 %
3
0 %
2
0 %
1
0 %
รีวิวจากลูกค้า
February 6, 2026
Calm decision layer for traders who combine signals before acting. It gives value around chart reading, but it should not be used as a blind entry trigger. The cleaner reads should hold across 3 sessions, not just 1 good chart. It is stronger when a 1.5R target is realistic before the entry.
February 5, 2026
February 5, 2026
Measured chart review for chart reading. it makes market context easier to scan, especially when used for adding confirmation before a trade. I would test it on 2 timeframes, 20 signals and a 1R stop plan. It is stronger when a 1.5R target is realistic before the entry.

คำถามที่พบบ่อย

Breakout
Scalping
SMC
ผลิตภัณฑ์ที่มีให้บริการผ่าน cTrader Store รวมถึงบอทการเทรด อินดิเคเตอร์ และปลั๊กอิน มีให้บริการโดยนักพัฒนาบุคคลที่สามและมีไว้เพื่อวัตถุประสงค์ในการเข้าถึงข้อมูลและทางเทคนิคเท่านั้น cTrader Store ไม่ใช่โบรกเกอร์และไม่ได้ให้คำแนะนำการลงทุน คำแนะนำส่วนบุคคล หรือการรับประกันผลการดำเนินงานในอนาคต

นอกจากนี้คุณยังอาจชอบ

อินดิเคเตอร์
SMC
Forex
+15
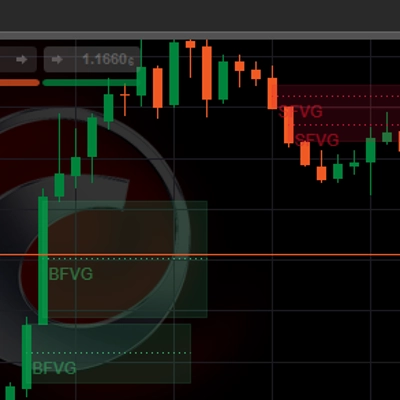
Smart institutional order block & FVG scanner with alerts, zone merging, and HTF confluence.
อินดิเคเตอร์
VWAP
Volume
+2
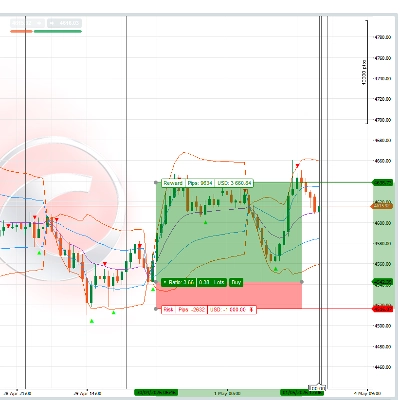
VWAP Bands and Swing Wick Structure Indicator
อินดิเคเตอร์
SMC
VWAP
+16
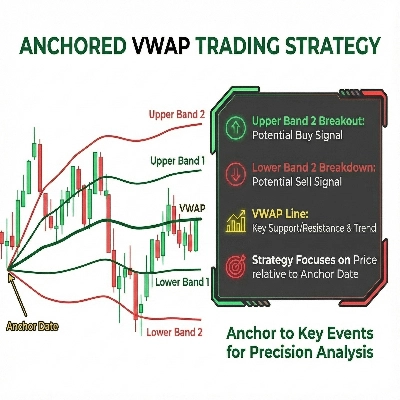
It calculates Anchored VWAP and StdDev bands from a user-defined start date for cTrader charts.
อินดิเคเตอร์
ATR
Signal
One of the best indicators we have ever developed, with a very high profit ratio.
อินดิเคเตอร์
AI
ATR
+27
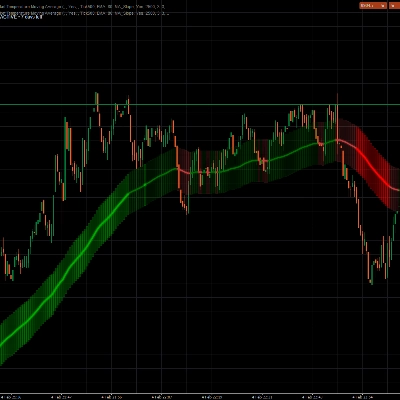
The "Market Temperature" Moving Average -Turn Your MA Into a Live Market Temperature Line
อินดิเคเตอร์
BOS
Imbalance
+4
Automatically detects and highlights both Bullish and Bearish Fair Value Gaps (FVGs).
อินดิเคเตอร์
VWAP
Support & Resistance
Trading.FC$_vwap Algo shows VWAP trends, dynamic support/resistance and deviation bands to spot potential trade entries.
อินดิเคเตอร์
ATR
RSI
+4
Adaptive Ichimoku with nine-factor confluence scoring, five signal types, smart TP/SL and an MTF panel.
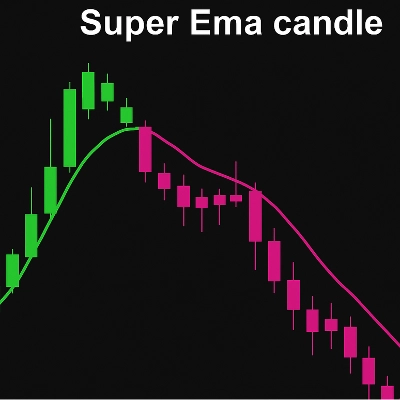
"Super Ema Candle" โลโก้
ยอดนิยม
4.3
(3)
$25
อินดิเคเตอร์
Forex
Crypto
+2
PREMIUN INDICATOR
อินดิเคเตอร์
VWAP
Volume
+1
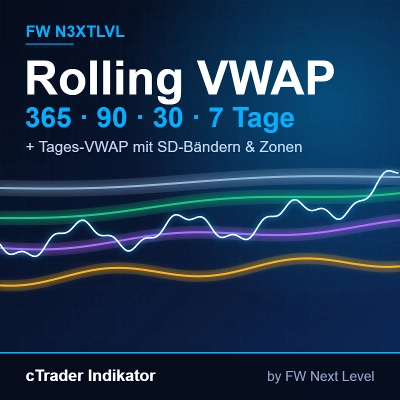
FW Next Level: Rolling VWAP für 7, 30, 90 und 365 Tage plus Tages-VWAP mit SD-Bändern und Preiszonen.
"VWAP_" โลโก้
ยอดนิยม
4.6
(3)
$25
$38
อินดิเคเตอร์
VWAP
Forex
+5
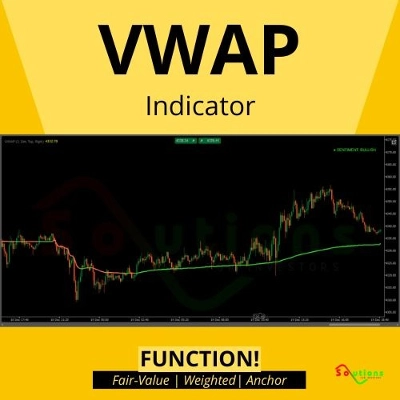
Trade with institutional accuracy. Identify fair price levels and high-volume zones instantly!
อินดิเคเตอร์
ATR
VWAP
+2
Swing anchor VWAP pullback signals, each with entry, stop and three targets drawn, seven filter profiles and auto pick
อินดิเคเตอร์
Fibonacci
Key Levels
+1
Swing point and Fibonacci levels.
อินดิเคเตอร์
ADX
CCI
+5
One momentum score from RSI, Stoch, CCI, MACD, ROC and MFI, with filtered signals, ATR levels, alerts and a webhook
อินดิเคเตอร์
RSI
Forex
+10
Unlock Stochastic RSI PRO in cTrader! Overlay RSI, highlight zones, and identify divergences with customizable settings.
อินดิเคเตอร์
Volume
Key Levels
Dynamic Visible Range Volume Profile for cTrader. Real-time POC, Value Area & Smart Alerts for precise trading.
"CVD Ai" โลโก้
ยอดนิยม
4.0
(2)
$35
$49
อินดิเคเตอร์
AI
ATR
+5
"Advanced VSA & CVD indicator with 'A+ Setup' filtering based on Support & Resistance levels."
อินดิเคเตอร์
ATR
Volume
+3
Fibonacci trend signals on closed bars, with an ATR stop, up to four targets and a break-even ladder.

ราคา

ตั้งแต่ 10/01/2026
7
การขาย